
|
Eagle Point Credit Company Inc. (ECC): Análisis de 5 Fuerzas [Actualizado en enero de 2025] |
Completamente Editable: Adáptelo A Sus Necesidades En Excel O Sheets
Diseño Profesional: Plantillas Confiables Y Estándares De La Industria
Predeterminadas Para Un Uso Rápido Y Eficiente
Compatible con MAC / PC, completamente desbloqueado
No Se Necesita Experiencia; Fáciles De Seguir
Eagle Point Credit Company Inc. (ECC) Bundle
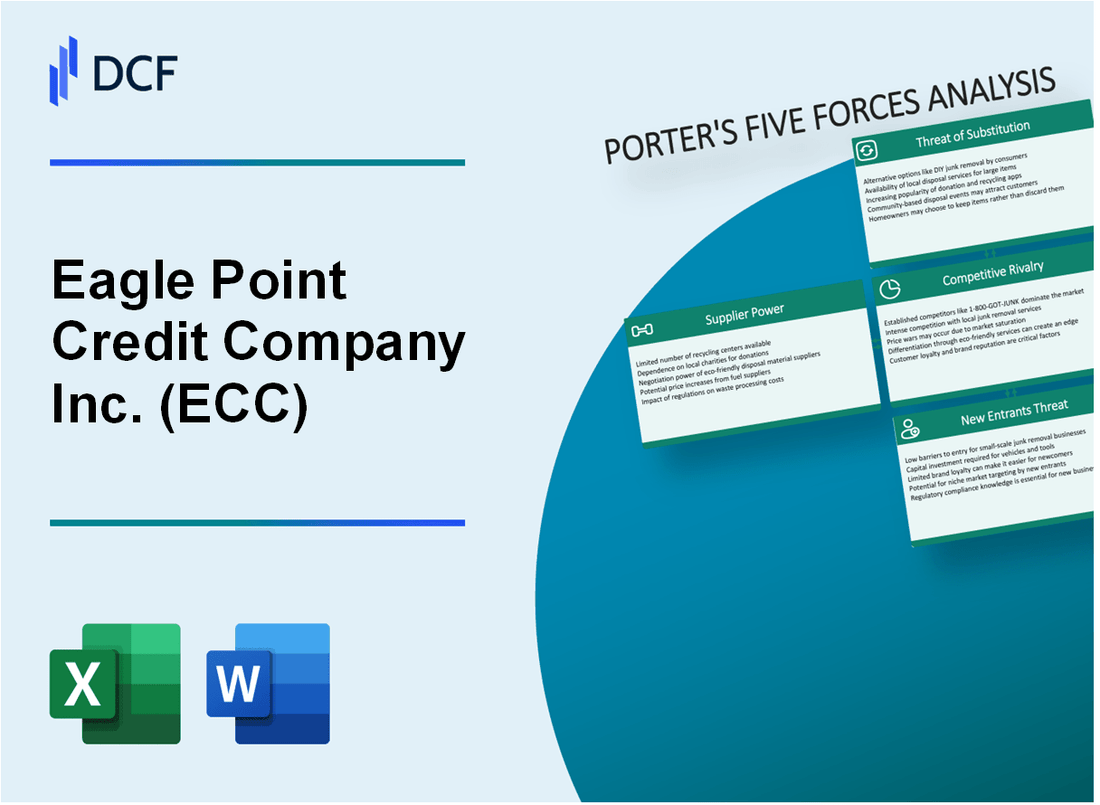
En el intrincado mundo de las inversiones crediticias estructuradas, Eagle Point Credit Company Inc. (ECC) navega por un panorama complejo donde el posicionamiento estratégico es primordial. Al diseccionar el marco de las cinco fuerzas de Michael Porter, desentrañamos la dinámica crítica que da forma al entorno competitivo del ECC, desde los poderes de negociación matizados de proveedores y clientes hasta las presiones competitivas, sustitutos potenciales y barreras de entrada que definen su ecosistema de mercado. Comprender estas fuerzas estratégicas proporciona una visión de afeitar la resiliencia, los desafíos y las posibles trayectorias de crecimiento en el mercado de crédito estructurado en constante evolución.
Eagle Point Credit Company Inc. (ECC) - Las cinco fuerzas de Porter: poder de negociación de los proveedores
Número limitado de gerentes especializados de CLO
A partir del cuarto trimestre de 2023, hay aproximadamente 47 empresas de gestión de CLO dedicadas en los Estados Unidos. Eagle Point Credit Company trabaja con un grupo selecto de estos gerentes.
| Categoría del gerente de CLO | Número de empresas | Cuota de mercado (%) |
|---|---|---|
| Gerentes de CLO de primer nivel | 12 | 38.5% |
| Gerentes de CLO de nivel medio | 22 | 35.7% |
| Gerentes boutique CLO | 13 | 25.8% |
Dependencia de los intermediarios del mercado de crédito
ECC se basa en los principales bancos de inversión para transacciones de crédito estructuradas. Los intermediarios clave incluyen:
- Goldman Sachs
- JPMorgan Chase
- Morgan Stanley
- Suisse de crédito
- Bank of America Merrill Lynch
Grupo restringido de creadores de préstamos apalancados de alta calidad
En 2023, el mercado de origen de préstamo apalancado muestra la concentración entre los jugadores clave:
| Creador de préstamos | Volumen total del préstamo ($ B) | Penetración del mercado (%) |
|---|---|---|
| Citigroup | 87.3 | 22.6% |
| Jpmorgan | 76.5 | 19.8% |
| Banco de América | 64.2 | 16.6% |
Mercado concentrado para experiencia crediticia estructurada
La experiencia en el mercado de crédito estructurado se limita a aproximadamente 35 empresas especializadas a nivel mundial, con las 10 principales empresas que controlan el 65% de las sofisticadas transacciones de crédito estructuradas.
- Las 3 empresas principales controlan el 42% del mercado de crédito estructurado
- Experiencia promedio de profesionales de crédito estructurado senior: 15.7 años
- Tamaño de transacción mediana: $ 487 millones
Eagle Point Credit Company Inc. (ECC) - Las cinco fuerzas de Porter: poder de negociación de los clientes
Inversores institucionales que buscan inversiones crediticias estructuradas
A partir del cuarto trimestre de 2023, Eagle Point Credit Company Inc. (ECC) administra $ 495.2 millones en activos totales, con inversores institucionales que representan el 78.6% de su base de accionistas. La cartera de capital de la compañía se valoró en $ 286.3 millones.
| Tipo de inversor | Porcentaje | Monto de la inversión |
|---|---|---|
| Inversores institucionales | 78.6% | $ 389.2 millones |
| Inversores minoristas | 21.4% | $ 106 millones |
Alta demanda de productos financieros diversificados que generan ingresos
La estrategia de inversión de CLO de ECC se dirige a un rendimiento anual del 12-14%, con un rendimiento actual en 13.2%. La cartera de la compañía incluye 42 inversiones diferentes de CLO en varias calificaciones crediticias.
- Tamaño promedio de inversión de CLO: $ 6.8 millones
- Diversificación de cartera: activos subyacentes de grado de inversión del 87%
- Rendimiento promedio ponderado: 13.2%
Inversores sofisticados con expectativas complejas de retorno de riesgo
| Riesgo de inversionista Profile | Porcentaje de asignación | Inversión promedio |
|---|---|---|
| Tolerancia de alto riesgo | 42% | $ 12.5 millones |
| Tolerancia a mediano | 38% | $ 7.3 millones |
| Tolerancia de bajo riesgo | 20% | $ 3.6 millones |
Presiones de precios competitivos en el mercado de inversiones de CLO
El valor de activos netos de ECC (NAV) al 31 de diciembre de 2023 era de $ 10.45 por acción, con un precio de mercado de $ 9.87, lo que refleja el 5.6% de descuento para NAV.
- Diferencia competitiva del mercado de CLO: 3.2-4.5%
- Diferencia de cartera promedio de ECC: 4.1%
- Tarifa de gestión promedio de CLO de la industria: 0.75%
Eagle Point Credit Company Inc. (ECC) - Las cinco fuerzas de Porter: rivalidad competitiva
Múltiples empresas de desarrollo de negocios en espacio de crédito estructurado
A partir de 2024, el mercado de crédito estructurado incluye aproximadamente 17 empresas de desarrollo de negocios (BDC) que compiten activamente en el segmento de cartera de préstamos apalancado. Eagle Point Credit Company enfrenta una competencia directa de:
- ARES Capital Corporation (ARCC)
- Golub Capital BDC Inc. (GBDC)
- Prospect Capital Corporation (PSEC)
- Monroe Capital Corporation (MRCC)
Análisis de paisaje competitivo
| Competidor | Activos totales | Capitalización de mercado | Rendimiento de dividendos |
|---|---|---|---|
| Compañía de crédito de Eagle Point | $ 581.2 millones | $ 234.5 millones | 12.3% |
| Ares Capital Corporation | $ 21.3 mil millones | $ 8.6 mil millones | 9.7% |
| Golub Capital BDC | $ 2.9 mil millones | $ 1.4 mil millones | 8.5% |
Presiones de rendimiento de dividendos competitivos
El rendimiento promedio de dividendos en el sector de BDC varía entre 8.5%y 13.2%, con Eagle Point Credit Company colocada cerca del cuartil superior al 12.3%.
Diferenciación de la estrategia de gestión de CLO
Métricas competitivas clave en la gestión de CLO:
- Tarifas promedio de gestión de la cartera: 0.50% a 1.25%
- Relaciones de apalancamiento típicas: 2.5x a 4.0x
- Calificación crediticia de la cartera promedio ponderada: B a B+
Tamaño del mercado de CLO en 2024: $ 872 mil millones Total de inversiones de crédito estructuradas pendientes.
Eagle Point Credit Company Inc. (ECC) - Las cinco fuerzas de Porter: amenaza de sustitutos
Vehículos de inversión de renta fija alternativa
Tamaño del mercado de bonos corporativos: $ 9.5 billones a partir del cuarto trimestre de 2023. Rendimiento promedio de bonos corporativos: 5.62% en diciembre de 2023.
| Vehículo de inversión | Rango de rendimiento | Riesgo Profile |
|---|---|---|
| Bonos de grado de inversión | 4.5% - 6.2% | Bajo a moderado |
| Bonos corporativos de alto rendimiento | 7.8% - 10.5% | Alto |
| Bonos municipales | 3.2% - 5.1% | Bajo |
Mercados de bonos de alto rendimiento
Volumen global del mercado de bonos de alto rendimiento: $ 1.3 billones en 2023. Difperre de crédito promedio: 425 puntos básicos.
- Tamaño del mercado de bonos de alto rendimiento de EE. UU.: $ 1.1 billones
- Mercado europeo de alto rendimiento: $ 220 mil millones
- Tasa de incumplimiento promedio: 3.7% en 2023
Fondos de deuda privada
Activos de deuda privada bajo administración: $ 1.7 billones a nivel mundial en 2023.
| Tipo de fondo | Aum | Retorno promedio |
|---|---|---|
| Fondos de préstamos directos | $ 850 mil millones | 8.5% |
| Fondos de deuda entre mezzaninos | $ 350 mil millones | 9.2% |
| Fondos de deuda angustiados | $ 500 mil millones | 11.3% |
Alternativas de crédito estructuradas emergentes
Tamaño del mercado de crédito estructurado: $ 620 mil millones en 2023.
- Volumen del mercado de CLO: $ 450 mil millones
- Valores respaldados por activos: $ 170 mil millones
- Rendimiento de crédito estructurado promedio: 7.9%
Eagle Point Credit Company Inc. (ECC) - Las cinco fuerzas de Porter: amenaza de nuevos participantes
Altos requisitos de cumplimiento regulatorio para gerentes de CLO
A partir de 2024, los gerentes de CLO enfrentan requisitos reglamentarios estrictos, que incluyen:
| Requisito regulatorio | Costo de cumplimiento |
|---|---|
| Registro de la SEC | $ 250,000 - $ 500,000 anualmente |
| Reglas de retención de riesgos | 5% de interés mínimo vertical u horizontal |
| Cumplimiento de Dodd-Frank | $ 750,000 - $ 1.2 millones por año |
Inversión de capital significativa para la plataforma CLO
Requisitos iniciales de capital para establecer una plataforma CLO:
- Capital de semillas mínimo: $ 50 millones
- Infraestructura tecnológica: $ 5-10 millones
- Inversión inicial de cartera: $ 100-250 millones
- Costos legales y de estructuración: $ 2-3 millones
Barrera de experiencia financiera estructurada compleja
| Nivel de experiencia | Se requieren años de experiencia | Compensación promedio |
|---|---|---|
| Estrucutador senior de CLO | 10-15 años | $ 350,000 - $ 750,000 anualmente |
| Analista de riesgos de crédito | 5-8 años | $ 180,000 - $ 300,000 anualmente |
Relaciones establecidas con participantes del mercado de crédito
Requisitos clave de la relación:
- Mínimo más de 5 años de relaciones de crédito institucional
- Redes activas con 20-30 inversores institucionales
- Truito comprobado de emisiones exitosas de CLO
Requisitos avanzados de infraestructura tecnológica
| Componente tecnológico | Inversión estimada |
|---|---|
| Software de gestión de riesgos | $ 1-2 millones |
| Plataformas comerciales | $ 500,000 - $ 1 millón |
| Sistemas de ciberseguridad | $ 750,000 - $ 1.5 millones |
Eagle Point Credit Company Inc. (ECC) - Porter's Five Forces: Competitive rivalry
Direct competition from other CLO-focused funds like Oxford Lane Capital (OXLC) is intense. You see this clearly when you compare their market presence and recent performance metrics. For instance, as of late November 2025, Eagle Point Credit Company Inc.'s market capitalization stood at approximately $679.04M, while Oxford Lane Capital Corp. was larger at $1.15B.
Rivalry is based on performance, distribution yield, and management's CLO expertise. Over the last 10 years, Eagle Point Credit Company Inc. has posted an annualized return of 5.27%, slightly ahead of Oxford Lane Capital Corp.'s 4.73% annualized return. However, looking at the trailing twelve months, Oxford Lane Capital Corp.'s dividend yield was higher at approximately 40.27% compared to Eagle Point Credit Company Inc.'s 30.09%.
| Metric (As of Nov 2025 Data) | Eagle Point Credit Company Inc. (ECC) | Oxford Lane Capital Corp. (OXLC) |
| 10-Year Annualized Return | 5.27% | 4.73% |
| Trailing Twelve Month Dividend Yield | 30.09% | 40.27% |
| Year-to-Date Return | -21.88% | -33.98% |
| P/B Ratio | 0.73 | 0.61 |
The expanding CLO market, with U.S. broadly syndicated loan (BSL) CLO gross issuance reaching $220 billion in the first half of 2025, mitigates zero-sum rivalry. This issuance was split between new deals at $83 billion and refinancings/resets at $137 billion. The overall U.S. loan market grew by $52 billion, or 3.7%, in the first half of 2025 alone. While the specific 11% CAGR through Q1 2025 isn't directly confirmed in the latest reports, the sheer volume suggests significant market expansion supporting multiple players.
Eagle Point Credit Company Inc. differentiates by actively managing its portfolio. For example, in the third quarter of 2025, the firm completed 11 resets and 16 refinancings. This activity helped extend the weighted average remaining reinvestment period (WARRP) of its CLO equity portfolio to 3.3 years as of October 31, 2025. This is notably longer than the 2.7 years reported as of June 30, 2024.
The CLO equity segment is a niche, but its returns are highly visible, fueling competition. Eagle Point Credit Company Inc. reported a weighted average effective yield of 16.9% on new CLO equity investments made during Q3 2025. The look-through weighted average spread of the underlying loans in its CLO equity portfolio was 3.25% as of September 2025.
Key portfolio activity and metrics for Eagle Point Credit Company Inc. as of Q3 2025:
- Net Asset Value (NAV) per common share: $7.00 as of September 30, 2025.
- Recurring cash flows: $77 million for Q3 2025.
- Net investment income (NII) per share: $0.24 for Q3 2025.
- Realized losses from investments per share: $0.08 for Q3 2025.
- Capital deployed into new investments in Q3 2025: Nearly $200 million.
Eagle Point Credit Company Inc. (ECC) - Porter's Five Forces: Threat of substitutes
You're looking at Eagle Point Credit Company Inc. (ECC) as a pure-play on CLO equity, but the real competition isn't just other CLO managers; it's every investment vehicle that promises a high, regular income stream. The threat of substitutes here is substantial because capital is fungible, and investors can easily pivot to comparable, or perhaps more liquid, options.
High-yield corporate bonds and Business Development Companies (BDCs) offer comparable income streams.
For income-focused investors, high-yield corporate bonds present a direct, often more familiar, alternative. As of October 2025, the US High Yield market's yield stood at 6.82%, contributing to a year-to-date return of 7.27%. While ECC's new CLO equity deployments in Q3 2025 targeted a weighted average effective yield of 16.9%, the market-wide yield for high-yield bonds is a baseline for comparison. BDCs, which are closely related as they often invest in similar underlying assets, offer another strong substitute. As of Q1 2025, the average first lien yield across BDC portfolios was 10.16%, with second lien yields at 13.24%. This means an investor can access yields in the double digits through the BDC structure, which itself managed a total fair value of $451.1 billion in public and private investments by Q1 2025. To be fair, ECC's portfolio expected yield of 18.28% (based on fair market value as of September 30, 2025) is higher, but the BDC sector, in aggregate, is currently trading below its long-term average price-to-book ratio, suggesting a potential value proposition for some investors.
The rapid growth of the private credit/direct lending market is a major, indirect substitute to the underlying loan collateral.
The entire private credit space, which ECC taps into via CLOs, is ballooning, meaning more capital is chasing the same assets, which can compress returns over time. This market grew to nearly $1.5 Trillion in Assets Under Management (AUM) in 2024 and is projected to reach $3.5 Trillion by 2028. This massive influx of capital from non-bank lenders means that the direct lending market itself is becoming a substitute for the CLO structure as a deployment vehicle for yield-seeking capital. Retail interest is also accelerating, with retail private debt AUM growing faster than institutional AUM, though it still represents less than 20% of the total private debt AUM. This growth suggests that capital that might have flowed into ECC's CLO equity or debt tranches is increasingly being absorbed directly into the private credit ecosystem.
New CLO-focused Exchange-Traded Funds (ETFs) are emerging, offering retail investors a more liquid, lower-cost access point.
ETFs provide a structural advantage in terms of daily liquidity, which is a major draw against the relative opacity of a closed-end fund like ECC, which has a market capitalization of about $781.07 million. The CLO ETF space has seen explosive growth, reaching about $33 billion in AUM across roughly 30 different funds as of September 2025. These ETFs, which primarily focus on the highly liquid AAA/AA tranches, now hold about 4% of total US CLO debt outstanding. For example, the Janus Henderson AAA CLO ETF (JAAA) had a trailing yield of 6.39% in early 2025. While ECC's Q3 2025 recurring cash distribution was $0.59 per common share, the ease of entry and exit, plus lower structural costs often associated with ETFs, makes them a compelling, lower-friction substitute for retail and even some institutional money.
Other closed-end funds (CEFs) specializing in fixed-income or multi-asset strategies are easy alternatives.
You don't have to stick with a pure-play CLO manager. Other CEFs offer high income with different risk profiles, and they are easy to access. For instance, a selected group of top CEFs in October 2025 offered an average distribution rate of 9.25%, with some even reaching yields up to 9.7%. Compare that to the current yield on the SPDR S&P 500 ETF Trust (SPY) at just 1.1%. Some of these alternative CEFs can offer dividend payouts over six times higher than a broad equity index fund. This means investors looking for high income can easily substitute ECC for a multi-asset CEF that might offer better diversification or a lower discount to NAV, especially since ECC's own NAV per share was estimated between $6.69 and $6.79 as of October 31, 2025.
Here's a quick look at the competitive income landscape:
| Substitute Asset Class | Relevant Metric/Data Point (Late 2025) | Value |
|---|---|---|
| Eagle Point Credit Company Inc. (ECC) Portfolio | Weighted Average Expected Yield (Fair Value, Sep 2025) | 18.28% |
| US High-Yield Corporate Bonds | Market Yield (October 2025) | 6.82% |
| BDCs (First Lien Yield) | Average Portfolio Yield (Q1 2025) | 10.16% |
| BDCs (Second Lien Yield) | Average Portfolio Yield (Q1 2025) | 13.24% |
| CLO ETFs (e.g., JAAA) | Trailing Yield (Early 2025) | 6.39% |
| Selected Income CEFs | Average Distribution Rate (October 2025) | 9.25% |
The availability of these alternatives means Eagle Point Credit Company Inc. must continually justify its structure and potential for higher returns against the backdrop of greater liquidity and established market benchmarks.
- Private Credit Market Size (2024): $1.5 Trillion.
- CLO ETF Total AUM (Sep 2025): Approximately $33 billion.
- ECC Q3 2025 Recurring Cash Distribution: $0.59 per common share.
- ECC New CLO Equity Yield (Q3 2025): 16.9%.
- BDC Market Share (Private BDCs, Q1 2025): Approximately 66% of total fair value.
Eagle Point Credit Company Inc. (ECC) - Porter's Five Forces: Threat of new entrants
You're looking at the barriers that keep a new player from easily setting up shop and competing directly with Eagle Point Credit Company Inc. The hurdles here are significant, rooted in complexity, regulation, and sheer size.
Barriers to entry are high due to the specialized credit analysis needed for 1,914 underlying obligors. Honestly, this isn't a business you can just jump into next quarter. Eagle Point Credit Company Inc. maintains exposure to 1,893 unique underlying loan obligors as of September 30, 2025, and the latest data shows 1,914 as of October 31, 2025. That level of granular due diligence on syndicated loans within CLO equity structures requires deep institutional knowledge.
Regulatory hurdles for a 1940 Act company require significant legal and compliance infrastructure. Any new entrant must register under the Investment Company Act of 1940, which mandates specific operating standards, board governance, and mandatory compliance programs. New entrants face scrutiny regarding leverage limits and overly complex capital structures, which adds substantial fixed overhead before a single dollar is deployed.
Substantial capital is needed to compete with Eagle Point Credit Company Inc.'s scale. As of Q3 2025, the company commanded a market capitalization of approximately $781.07 million. Competing at scale means being able to deploy capital efficiently across primary and secondary markets, something smaller funds struggle to match. For instance, Eagle Point Credit Company Inc. deployed nearly $200 million into new investments in Q3 2025 alone. If you can't match that deployment pace, you're playing catch-up.
The attractive arbitrage and high yields are drawing new players, as seen by the overall market growth. The private credit space is definitely getting crowded, which signals opportunity but also increased competition for deal flow. Here's the quick math on market expansion:
| Market Metric | Value/Estimate | Date/Period |
|---|---|---|
| US CLOs Outstanding | $1,152 billion | 2025 |
| US CLO CAGR (since 2018) | 11% | Through 2025 |
| Global Private Credit AUM Estimate | $3 trillion | By 2028 |
| Weighted Average Effective Yield on New CLO Equity | 16.9% | Q3 2025 |
Still, the complexity of the underlying assets acts as a natural filter. New entrants must prove they can navigate the structure, especially when leverage is running high, like Eagle Point Credit Company Inc.'s 42% debt plus preferred securities to assets as of Q3 2025, which is above their target band of 27.5% to 37.5%. What this estimate hides is the cost of building the specialized team required to manage that risk profile.
The threat is moderated by the specialized nature of the investment, but the overall market tailwinds are undeniable. New entrants are looking at:
- Accessing the $1.152 trillion US CLO market.
- Building expertise in CLO equity analysis.
- Securing necessary 1940 Act compliance infrastructure.
- Achieving scale above the $781.07 million market cap level.
- Generating yields comparable to the 16.9% seen on new Q3 2025 equity deployments.
Finance: draft memo on competitor compliance structure costs by next Tuesday.
Disclaimer
All information, articles, and product details provided on this website are for general informational and educational purposes only. We do not claim any ownership over, nor do we intend to infringe upon, any trademarks, copyrights, logos, brand names, or other intellectual property mentioned or depicted on this site. Such intellectual property remains the property of its respective owners, and any references here are made solely for identification or informational purposes, without implying any affiliation, endorsement, or partnership.
We make no representations or warranties, express or implied, regarding the accuracy, completeness, or suitability of any content or products presented. Nothing on this website should be construed as legal, tax, investment, financial, medical, or other professional advice. In addition, no part of this site—including articles or product references—constitutes a solicitation, recommendation, endorsement, advertisement, or offer to buy or sell any securities, franchises, or other financial instruments, particularly in jurisdictions where such activity would be unlawful.
All content is of a general nature and may not address the specific circumstances of any individual or entity. It is not a substitute for professional advice or services. Any actions you take based on the information provided here are strictly at your own risk. You accept full responsibility for any decisions or outcomes arising from your use of this website and agree to release us from any liability in connection with your use of, or reliance upon, the content or products found herein.