
|
Eagle Point Credit Company Inc. (ECC): 5 Analyse des forces [Jan-2025 MISE À JOUR] |
Entièrement Modifiable: Adapté À Vos Besoins Dans Excel Ou Sheets
Conception Professionnelle: Modèles Fiables Et Conformes Aux Normes Du Secteur
Pré-Construits Pour Une Utilisation Rapide Et Efficace
Compatible MAC/PC, entièrement débloqué
Aucune Expertise N'Est Requise; Facile À Suivre
Eagle Point Credit Company Inc. (ECC) Bundle
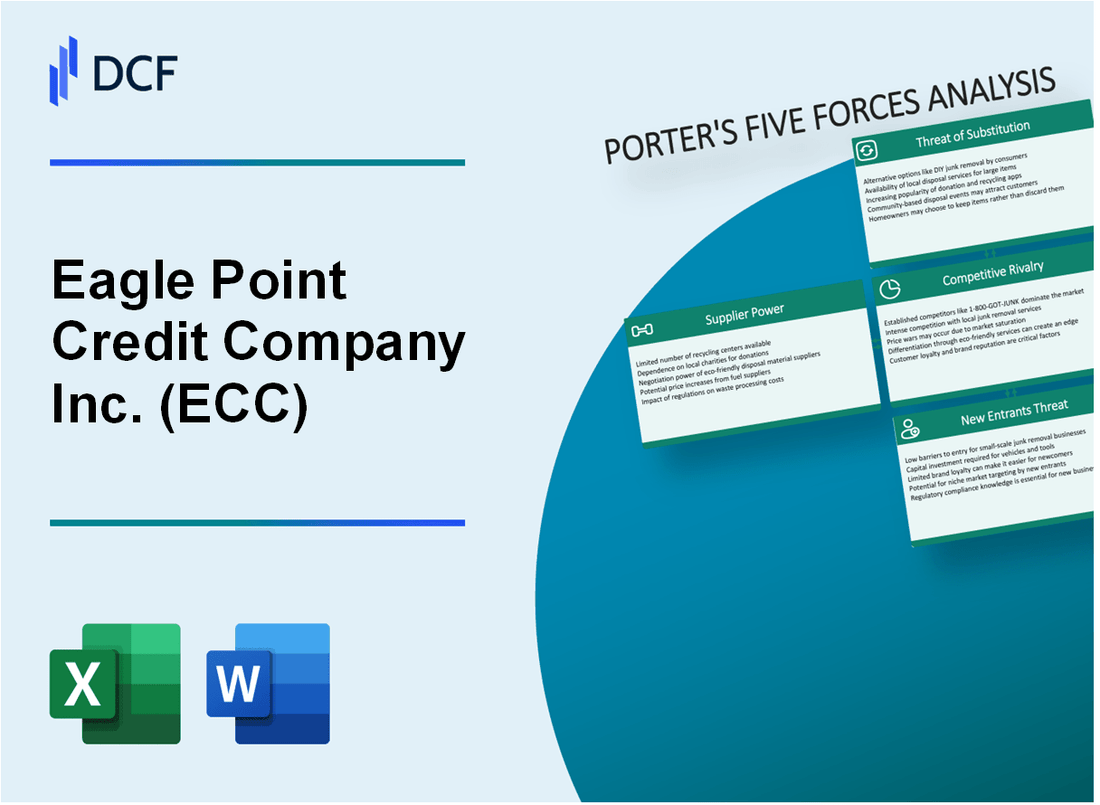
Dans le monde complexe des investissements de crédit structurés, Eagle Point Credit Company Inc. (ECC) navigue dans un paysage complexe où le positionnement stratégique est primordial. En disséquant le cadre des cinq forces de Michael Porter, nous démêlons la dynamique critique façonnant l'environnement concurrentiel de l'ECC - des pouvoirs de négociation nuancés des fournisseurs et des clients aux pressions concurrentielles, aux substituts potentiels et aux obstacles à l'entrée qui définissent son écosystème de marché. Comprendre ces forces stratégiques fournit un aperçu de la résilience, des défis et des trajectoires de croissance potentielles de l'entreprise sur le marché du crédit structuré en constante évolution.
Eagle Point Credit Company Inc. (ECC) - Porter's Five Forces: Bargaining Power of Fournissers
Nombre limité de gestionnaires de CLO spécialisés
Au quatrième trimestre 2023, il y a environ 47 sociétés de gestion de CLO dédiées aux États-Unis. Eagle Point Credit Company travaille avec un groupe restreint de ces gestionnaires.
| Catégorie CLO Manager | Nombre d'entreprises | Part de marché (%) |
|---|---|---|
| Gestionnaires de CLO de haut niveau | 12 | 38.5% |
| Gestionnaires de CLO de niveau intermédiaire | 22 | 35.7% |
| Boutiques CLO Managers | 13 | 25.8% |
Dépendance à l'égard des intermédiaires du marché du crédit
L'ECC s'appuie sur les grandes banques d'investissement pour les transactions de crédit structurées. Les intermédiaires clés comprennent:
- Goldman Sachs
- JPMorgan Chase
- Morgan Stanley
- Credit Suisse
- Bank of America Merrill Lynch
Pool restreint de créateurs de prêts à effet de violation de haute qualité
En 2023, le marché de l'origine des prêts à effet de levier montre la concentration parmi les acteurs clés:
| Initiateur de prêt | Volume total des prêts ($ b) | Pénétration du marché (%) |
|---|---|---|
| Citigroup | 87.3 | 22.6% |
| Jpmorgan | 76.5 | 19.8% |
| Banque d'Amérique | 64.2 | 16.6% |
Marché concentré pour une expertise en crédit structuré
L'expertise structurée du marché du crédit est limitée à environ 35 entreprises spécialisées dans le monde, les 10 meilleures entreprises contrôlant 65% des transactions de crédit structurées sophistiquées.
- Les 3 meilleures entreprises contrôlent 42% du marché du crédit structuré
- Expérience moyenne des professionnels du crédit structuré seniors: 15,7 ans
- Taille médiane des transactions: 487 millions de dollars
Eagle Point Credit Company Inc. (ECC) - Porter's Five Forces: Bargaining Power of Clients
Investisseurs institutionnels à la recherche d'investissements de crédit structurés
Au quatrième trimestre 2023, Eagle Point Credit Company Inc. (ECC) gère 495,2 millions de dollars d'actifs totaux, les investisseurs institutionnels représentant 78,6% de sa base d'actionnaires. Le portefeuille CLO Equity de la société était évalué à 286,3 millions de dollars.
| Type d'investisseur | Pourcentage | Montant d'investissement |
|---|---|---|
| Investisseurs institutionnels | 78.6% | 389,2 millions de dollars |
| Investisseurs de détail | 21.4% | 106 millions de dollars |
Demande élevée de produits financiers générateurs de revenus diversifiés
La stratégie d'investissement de CLO d'ECC cible un rendement annuel de 12 à 14%, avec un rendement actuel à 13,2%. Le portefeuille de la société comprend 42 investissements CLO différents à travers différentes cotes de crédit.
- Taille moyenne des investissements CLO: 6,8 millions de dollars
- Diversification du portefeuille: 87% d'actifs sous-jacents de qualité investissement
- Rendement moyen pondéré: 13,2%
Investisseurs sophistiqués avec des attentes de rendement du risque complexes
| Risque d'investisseur Profile | Pourcentage d'allocation | Investissement moyen |
|---|---|---|
| Tolérance à haut risque | 42% | 12,5 millions de dollars |
| Tolérance à risque moyen | 38% | 7,3 millions de dollars |
| Tolérance à faible risque | 20% | 3,6 millions de dollars |
Pressions de prix compétitives sur le marché des investissements CLO
La valeur active de l'ECC (NAV) au 31 décembre 2023 était de 10,45 $ par action, avec un prix du marché de 9,87 $, reflétant une remise de 5,6% par rapport au NAV.
- Propagation du marché CLO concurrentiel: 3,2-4,5%
- Portefeuille moyen du portefeuille de l'ECC: 4,1%
- Frais de gestion moyens du CLO de l'industrie: 0,75%
Eagle Point Credit Company Inc. (ECC) - Porter's Five Forces: Rivalry compétitif
Plusieurs sociétés de développement commercial dans un espace de crédit structuré
En 2024, le marché du crédit structuré comprend environ 17 sociétés de développement commercial (BDCS) activement concurrentes dans le segment du portefeuille de prêts à effet de levier. Eagle Point Credit Company fait face à une concurrence directe depuis:
- ARES Capital Corporation (ARCC)
- Golub Capital BDC Inc. (GBDC)
- Prospect Capital Corporation (PSEC)
- Monroe Capital Corporation (MRCC)
Analyse du paysage concurrentiel
| Concurrent | Actif total | Capitalisation boursière | Rendement des dividendes |
|---|---|---|---|
| Eagle Point Credit Company | 581,2 millions de dollars | 234,5 millions de dollars | 12.3% |
| ARES Capital Corporation | 21,3 milliards de dollars | 8,6 milliards de dollars | 9.7% |
| Golub Capital BDC | 2,9 milliards de dollars | 1,4 milliard de dollars | 8.5% |
Pressions de rendement en dividende compétitif
Le rendement moyen des dividendes dans le secteur BDC varie entre 8,5% et 13,2%, avec Eagle Point Credit Company positionné près du quartile supérieur à 12,3%.
Différenciation de la stratégie de gestion de CLO
Mesures compétitives clés dans la gestion de la CLO:
- Frais de gestion du portefeuille moyen: 0,50% à 1,25%
- Ratios de levier typiques: 2,5x à 4,0x
- Évaluation de crédit moyen pondérée du portefeuille: B à B +
Taille du marché de la CLO en 2024: 872 milliards de dollars d'investissements de crédit structurés en circulation totaux.
Eagle Point Credit Company Inc. (ECC) - Five Forces de Porter: menace de substituts
Véhicules d'investissement à revenu fixe alternatif
Taille du marché des obligations des sociétés: 9,5 billions de dollars au quatrième trimestre 2023. Rendement moyen des obligations des sociétés: 5,62% en décembre 2023.
| Véhicule d'investissement | Plage de rendement | Risque Profile |
|---|---|---|
| Obligations de qualité investissement | 4.5% - 6.2% | Faible à modéré |
| Obligations sociales à haut rendement | 7.8% - 10.5% | Haut |
| Obligations municipales | 3.2% - 5.1% | Faible |
Marchés d'obligations à haut rendement
Volume mondial du marché des obligations à haut rendement: 1,3 billion de dollars en 2023. Tread de crédit moyen: 425 points de base.
- Taille du marché des obligations à haut rendement américain: 1,1 billion de dollars
- Marché européen à haut rendement: 220 milliards de dollars
- Taux par défaut moyen: 3,7% en 2023
Fonds de dette privés
Actifs de la dette privée sous gestion: 1,7 billion de dollars dans le monde en 2023.
| Type de fonds | Aum | Rendement moyen |
|---|---|---|
| Fonds de prêt direct | 850 milliards de dollars | 8.5% |
| Fonds de dette de mezzanine | 350 milliards de dollars | 9.2% |
| Fonds de dette en détresse | 500 milliards de dollars | 11.3% |
Alternatives de crédit structurées émergentes
Taille du marché du crédit structuré: 620 milliards de dollars en 2023.
- Volume du marché CLO: 450 milliards de dollars
- Titres soutenus par des actifs: 170 milliards de dollars
- Rendement de crédit structuré moyen: 7,9%
Eagle Point Credit Company Inc. (ECC) - Five Forces de Porter: menace de nouveaux entrants
Exigences de conformité réglementaire élevées pour les gestionnaires de CLO
En 2024, les gestionnaires de CLO sont confrontés à des exigences réglementaires strictes, notamment:
| Exigence réglementaire | Coût de conformité |
|---|---|
| Enregistrement de la SEC | 250 000 $ - 500 000 $ par an |
| Règles de rétention des risques | 5% d'intérêt vertical ou horizontal minimum |
| Conformité Dodd-Frank | 750 000 $ - 1,2 million de dollars par an |
Investissement en capital important pour la plateforme CLO
Exigences de fonds propres initiales pour établir une plate-forme CLO:
- Capital de semence minimum: 50 millions de dollars
- Infrastructure technologique: 5 à 10 millions de dollars
- Investissement initial du portefeuille: 100-250 millions de dollars
- Coûts juridiques et de structuration: 2 à 3 millions de dollars
Barrière d'expertise en finance structurée complexe
| Niveau d'expertise | Des années d'expérience requises | Compensation moyenne |
|---|---|---|
| Structureur de CLO senior | 10-15 ans | 350 000 $ - 750 000 $ par an |
| Analyste des risques de crédit | 5-8 ans | 180 000 $ - 300 000 $ par an |
Relations établies avec les participants au marché du crédit
Exigences de relation clés:
- Minimum 5 ans et plus de relations de crédit institutionnelles
- Réseaux actifs avec 20 à 30 investisseurs institutionnels
- Bouchonnerie éprouvée des émissions de CLO réussies
Exigences avancées d'infrastructure technologique
| Composant technologique | Investissement estimé |
|---|---|
| Logiciel de gestion des risques | 1 à 2 millions de dollars |
| Plates-formes de trading | 500 000 $ - 1 million de dollars |
| Systèmes de cybersécurité | 750 000 $ - 1,5 million de dollars |
Eagle Point Credit Company Inc. (ECC) - Porter's Five Forces: Competitive rivalry
Direct competition from other CLO-focused funds like Oxford Lane Capital (OXLC) is intense. You see this clearly when you compare their market presence and recent performance metrics. For instance, as of late November 2025, Eagle Point Credit Company Inc.'s market capitalization stood at approximately $679.04M, while Oxford Lane Capital Corp. was larger at $1.15B.
Rivalry is based on performance, distribution yield, and management's CLO expertise. Over the last 10 years, Eagle Point Credit Company Inc. has posted an annualized return of 5.27%, slightly ahead of Oxford Lane Capital Corp.'s 4.73% annualized return. However, looking at the trailing twelve months, Oxford Lane Capital Corp.'s dividend yield was higher at approximately 40.27% compared to Eagle Point Credit Company Inc.'s 30.09%.
| Metric (As of Nov 2025 Data) | Eagle Point Credit Company Inc. (ECC) | Oxford Lane Capital Corp. (OXLC) |
| 10-Year Annualized Return | 5.27% | 4.73% |
| Trailing Twelve Month Dividend Yield | 30.09% | 40.27% |
| Year-to-Date Return | -21.88% | -33.98% |
| P/B Ratio | 0.73 | 0.61 |
The expanding CLO market, with U.S. broadly syndicated loan (BSL) CLO gross issuance reaching $220 billion in the first half of 2025, mitigates zero-sum rivalry. This issuance was split between new deals at $83 billion and refinancings/resets at $137 billion. The overall U.S. loan market grew by $52 billion, or 3.7%, in the first half of 2025 alone. While the specific 11% CAGR through Q1 2025 isn't directly confirmed in the latest reports, the sheer volume suggests significant market expansion supporting multiple players.
Eagle Point Credit Company Inc. differentiates by actively managing its portfolio. For example, in the third quarter of 2025, the firm completed 11 resets and 16 refinancings. This activity helped extend the weighted average remaining reinvestment period (WARRP) of its CLO equity portfolio to 3.3 years as of October 31, 2025. This is notably longer than the 2.7 years reported as of June 30, 2024.
The CLO equity segment is a niche, but its returns are highly visible, fueling competition. Eagle Point Credit Company Inc. reported a weighted average effective yield of 16.9% on new CLO equity investments made during Q3 2025. The look-through weighted average spread of the underlying loans in its CLO equity portfolio was 3.25% as of September 2025.
Key portfolio activity and metrics for Eagle Point Credit Company Inc. as of Q3 2025:
- Net Asset Value (NAV) per common share: $7.00 as of September 30, 2025.
- Recurring cash flows: $77 million for Q3 2025.
- Net investment income (NII) per share: $0.24 for Q3 2025.
- Realized losses from investments per share: $0.08 for Q3 2025.
- Capital deployed into new investments in Q3 2025: Nearly $200 million.
Eagle Point Credit Company Inc. (ECC) - Porter's Five Forces: Threat of substitutes
You're looking at Eagle Point Credit Company Inc. (ECC) as a pure-play on CLO equity, but the real competition isn't just other CLO managers; it's every investment vehicle that promises a high, regular income stream. The threat of substitutes here is substantial because capital is fungible, and investors can easily pivot to comparable, or perhaps more liquid, options.
High-yield corporate bonds and Business Development Companies (BDCs) offer comparable income streams.
For income-focused investors, high-yield corporate bonds present a direct, often more familiar, alternative. As of October 2025, the US High Yield market's yield stood at 6.82%, contributing to a year-to-date return of 7.27%. While ECC's new CLO equity deployments in Q3 2025 targeted a weighted average effective yield of 16.9%, the market-wide yield for high-yield bonds is a baseline for comparison. BDCs, which are closely related as they often invest in similar underlying assets, offer another strong substitute. As of Q1 2025, the average first lien yield across BDC portfolios was 10.16%, with second lien yields at 13.24%. This means an investor can access yields in the double digits through the BDC structure, which itself managed a total fair value of $451.1 billion in public and private investments by Q1 2025. To be fair, ECC's portfolio expected yield of 18.28% (based on fair market value as of September 30, 2025) is higher, but the BDC sector, in aggregate, is currently trading below its long-term average price-to-book ratio, suggesting a potential value proposition for some investors.
The rapid growth of the private credit/direct lending market is a major, indirect substitute to the underlying loan collateral.
The entire private credit space, which ECC taps into via CLOs, is ballooning, meaning more capital is chasing the same assets, which can compress returns over time. This market grew to nearly $1.5 Trillion in Assets Under Management (AUM) in 2024 and is projected to reach $3.5 Trillion by 2028. This massive influx of capital from non-bank lenders means that the direct lending market itself is becoming a substitute for the CLO structure as a deployment vehicle for yield-seeking capital. Retail interest is also accelerating, with retail private debt AUM growing faster than institutional AUM, though it still represents less than 20% of the total private debt AUM. This growth suggests that capital that might have flowed into ECC's CLO equity or debt tranches is increasingly being absorbed directly into the private credit ecosystem.
New CLO-focused Exchange-Traded Funds (ETFs) are emerging, offering retail investors a more liquid, lower-cost access point.
ETFs provide a structural advantage in terms of daily liquidity, which is a major draw against the relative opacity of a closed-end fund like ECC, which has a market capitalization of about $781.07 million. The CLO ETF space has seen explosive growth, reaching about $33 billion in AUM across roughly 30 different funds as of September 2025. These ETFs, which primarily focus on the highly liquid AAA/AA tranches, now hold about 4% of total US CLO debt outstanding. For example, the Janus Henderson AAA CLO ETF (JAAA) had a trailing yield of 6.39% in early 2025. While ECC's Q3 2025 recurring cash distribution was $0.59 per common share, the ease of entry and exit, plus lower structural costs often associated with ETFs, makes them a compelling, lower-friction substitute for retail and even some institutional money.
Other closed-end funds (CEFs) specializing in fixed-income or multi-asset strategies are easy alternatives.
You don't have to stick with a pure-play CLO manager. Other CEFs offer high income with different risk profiles, and they are easy to access. For instance, a selected group of top CEFs in October 2025 offered an average distribution rate of 9.25%, with some even reaching yields up to 9.7%. Compare that to the current yield on the SPDR S&P 500 ETF Trust (SPY) at just 1.1%. Some of these alternative CEFs can offer dividend payouts over six times higher than a broad equity index fund. This means investors looking for high income can easily substitute ECC for a multi-asset CEF that might offer better diversification or a lower discount to NAV, especially since ECC's own NAV per share was estimated between $6.69 and $6.79 as of October 31, 2025.
Here's a quick look at the competitive income landscape:
| Substitute Asset Class | Relevant Metric/Data Point (Late 2025) | Value |
|---|---|---|
| Eagle Point Credit Company Inc. (ECC) Portfolio | Weighted Average Expected Yield (Fair Value, Sep 2025) | 18.28% |
| US High-Yield Corporate Bonds | Market Yield (October 2025) | 6.82% |
| BDCs (First Lien Yield) | Average Portfolio Yield (Q1 2025) | 10.16% |
| BDCs (Second Lien Yield) | Average Portfolio Yield (Q1 2025) | 13.24% |
| CLO ETFs (e.g., JAAA) | Trailing Yield (Early 2025) | 6.39% |
| Selected Income CEFs | Average Distribution Rate (October 2025) | 9.25% |
The availability of these alternatives means Eagle Point Credit Company Inc. must continually justify its structure and potential for higher returns against the backdrop of greater liquidity and established market benchmarks.
- Private Credit Market Size (2024): $1.5 Trillion.
- CLO ETF Total AUM (Sep 2025): Approximately $33 billion.
- ECC Q3 2025 Recurring Cash Distribution: $0.59 per common share.
- ECC New CLO Equity Yield (Q3 2025): 16.9%.
- BDC Market Share (Private BDCs, Q1 2025): Approximately 66% of total fair value.
Eagle Point Credit Company Inc. (ECC) - Porter's Five Forces: Threat of new entrants
You're looking at the barriers that keep a new player from easily setting up shop and competing directly with Eagle Point Credit Company Inc. The hurdles here are significant, rooted in complexity, regulation, and sheer size.
Barriers to entry are high due to the specialized credit analysis needed for 1,914 underlying obligors. Honestly, this isn't a business you can just jump into next quarter. Eagle Point Credit Company Inc. maintains exposure to 1,893 unique underlying loan obligors as of September 30, 2025, and the latest data shows 1,914 as of October 31, 2025. That level of granular due diligence on syndicated loans within CLO equity structures requires deep institutional knowledge.
Regulatory hurdles for a 1940 Act company require significant legal and compliance infrastructure. Any new entrant must register under the Investment Company Act of 1940, which mandates specific operating standards, board governance, and mandatory compliance programs. New entrants face scrutiny regarding leverage limits and overly complex capital structures, which adds substantial fixed overhead before a single dollar is deployed.
Substantial capital is needed to compete with Eagle Point Credit Company Inc.'s scale. As of Q3 2025, the company commanded a market capitalization of approximately $781.07 million. Competing at scale means being able to deploy capital efficiently across primary and secondary markets, something smaller funds struggle to match. For instance, Eagle Point Credit Company Inc. deployed nearly $200 million into new investments in Q3 2025 alone. If you can't match that deployment pace, you're playing catch-up.
The attractive arbitrage and high yields are drawing new players, as seen by the overall market growth. The private credit space is definitely getting crowded, which signals opportunity but also increased competition for deal flow. Here's the quick math on market expansion:
| Market Metric | Value/Estimate | Date/Period |
|---|---|---|
| US CLOs Outstanding | $1,152 billion | 2025 |
| US CLO CAGR (since 2018) | 11% | Through 2025 |
| Global Private Credit AUM Estimate | $3 trillion | By 2028 |
| Weighted Average Effective Yield on New CLO Equity | 16.9% | Q3 2025 |
Still, the complexity of the underlying assets acts as a natural filter. New entrants must prove they can navigate the structure, especially when leverage is running high, like Eagle Point Credit Company Inc.'s 42% debt plus preferred securities to assets as of Q3 2025, which is above their target band of 27.5% to 37.5%. What this estimate hides is the cost of building the specialized team required to manage that risk profile.
The threat is moderated by the specialized nature of the investment, but the overall market tailwinds are undeniable. New entrants are looking at:
- Accessing the $1.152 trillion US CLO market.
- Building expertise in CLO equity analysis.
- Securing necessary 1940 Act compliance infrastructure.
- Achieving scale above the $781.07 million market cap level.
- Generating yields comparable to the 16.9% seen on new Q3 2025 equity deployments.
Finance: draft memo on competitor compliance structure costs by next Tuesday.
Disclaimer
All information, articles, and product details provided on this website are for general informational and educational purposes only. We do not claim any ownership over, nor do we intend to infringe upon, any trademarks, copyrights, logos, brand names, or other intellectual property mentioned or depicted on this site. Such intellectual property remains the property of its respective owners, and any references here are made solely for identification or informational purposes, without implying any affiliation, endorsement, or partnership.
We make no representations or warranties, express or implied, regarding the accuracy, completeness, or suitability of any content or products presented. Nothing on this website should be construed as legal, tax, investment, financial, medical, or other professional advice. In addition, no part of this site—including articles or product references—constitutes a solicitation, recommendation, endorsement, advertisement, or offer to buy or sell any securities, franchises, or other financial instruments, particularly in jurisdictions where such activity would be unlawful.
All content is of a general nature and may not address the specific circumstances of any individual or entity. It is not a substitute for professional advice or services. Any actions you take based on the information provided here are strictly at your own risk. You accept full responsibility for any decisions or outcomes arising from your use of this website and agree to release us from any liability in connection with your use of, or reliance upon, the content or products found herein.