
|
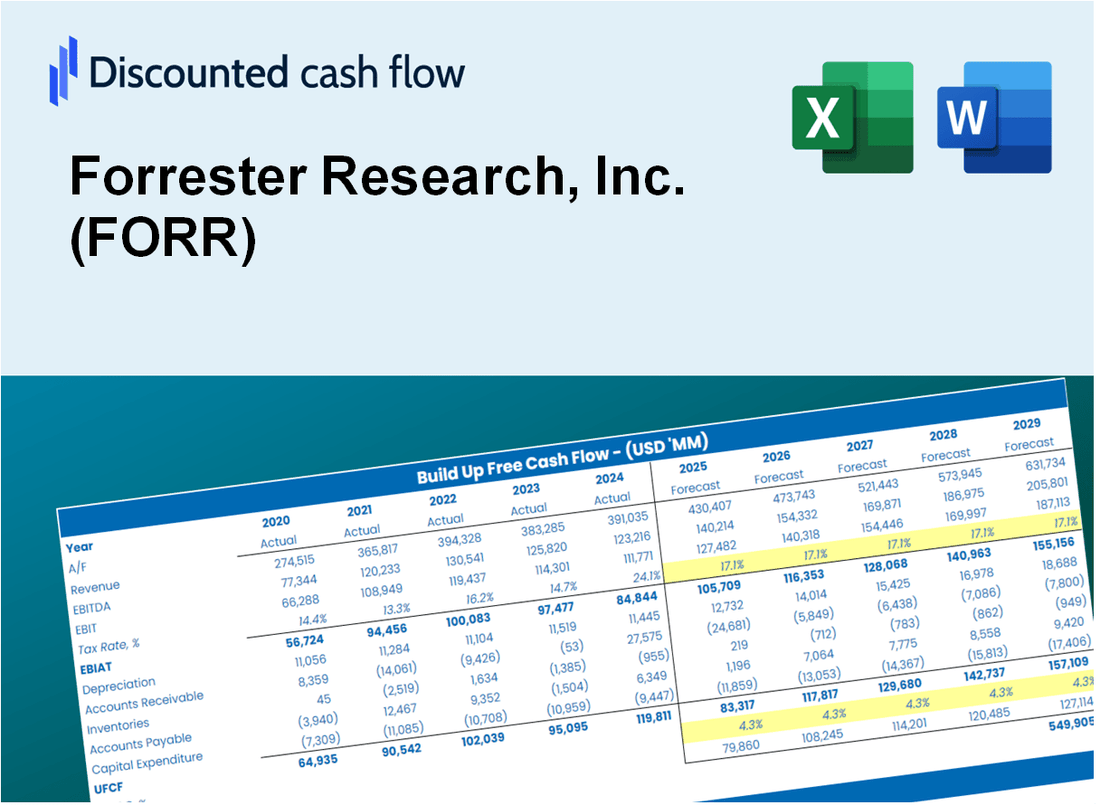
Valoración DCF de Forrester Research, Inc. (FORR) |
Completamente Editable: Adáptelo A Sus Necesidades En Excel O Sheets
Diseño Profesional: Plantillas Confiables Y Estándares De La Industria
Predeterminadas Para Un Uso Rápido Y Eficiente
Compatible con MAC / PC, completamente desbloqueado
No Se Necesita Experiencia; Fáciles De Seguir
Forrester Research, Inc. (FORR) Bundle
¡Simplifique la valoración de Forrester Research, Inc. (FORR) con esta calculadora DCF personalizable! Con el Real Forrester Research, Inc. (FORR) Financials y las entradas de pronóstico ajustables, puede probar escenarios y descubrir el valor razonable de Forrester Research, Inc. (FORR) en minutos.
Discounted Cash Flow (DCF) - (USD MM)
| Year | AY1 2020 |
AY2 2021 |
AY3 2022 |
AY4 2023 |
AY5 2024 |
FY1 2025 |
FY2 2026 |
FY3 2027 |
FY4 2028 |
FY5 2029 |
|---|---|---|---|---|---|---|---|---|---|---|
| Revenue | 449.0 | 494.3 | 537.8 | 480.8 | 432.5 | 430.6 | 428.7 | 426.8 | 424.9 | 423.1 |
| Revenue Growth, % | 0 | 10.1 | 8.79 | -10.6 | -10.05 | -0.43945 | -0.43945 | -0.43945 | -0.43945 | -0.43945 |
| EBITDA | 98.1 | 116.1 | 70.1 | 41.4 | 35.8 | 64.8 | 64.5 | 64.2 | 64.0 | 63.7 |
| EBITDA, % | 21.84 | 23.49 | 13.03 | 8.61 | 8.29 | 15.05 | 15.05 | 15.05 | 15.05 | 15.05 |
| Depreciation | 80.7 | 78.9 | 36.9 | 32.1 | 30.2 | 46.9 | 46.7 | 46.5 | 46.3 | 46.1 |
| Depreciation, % | 17.96 | 15.97 | 6.87 | 6.67 | 6.98 | 10.89 | 10.89 | 10.89 | 10.89 | 10.89 |
| EBIT | 17.4 | 37.2 | 33.2 | 9.3 | 5.6 | 17.9 | 17.8 | 17.8 | 17.7 | 17.6 |
| EBIT, % | 3.88 | 7.52 | 6.17 | 1.94 | 1.31 | 4.16 | 4.16 | 4.16 | 4.16 | 4.16 |
| Total Cash | 90.3 | 134.3 | 123.3 | 124.5 | 104.7 | 103.6 | 103.1 | 102.7 | 102.2 | 101.8 |
| Total Cash, percent | .0 | .0 | .0 | .0 | .0 | .0 | .0 | .0 | .0 | .0 |
| Account Receivables | 84.7 | 87.0 | 73.3 | 59.0 | 55.5 | 64.8 | 64.5 | 64.2 | 63.9 | 63.6 |
| Account Receivables, % | 18.86 | 17.59 | 13.64 | 12.27 | 12.83 | 15.04 | 15.04 | 15.04 | 15.04 | 15.04 |
| Inventories | 23.6 | 29.6 | 24.6 | .0 | .0 | 13.6 | 13.6 | 13.5 | 13.4 | 13.4 |
| Inventories, % | 5.26 | 5.99 | 4.57 | 0 | 0 | 3.16 | 3.16 | 3.16 | 3.16 | 3.16 |
| Accounts Payable | .7 | .8 | .4 | 1.8 | 1.0 | .8 | .8 | .8 | .8 | .8 |
| Accounts Payable, % | 0.14633 | 0.16993 | 0.06712695 | 0.37356 | 0.22314 | 0.19602 | 0.19602 | 0.19602 | 0.19602 | 0.19602 |
| Capital Expenditure | -8.9 | -10.7 | -5.7 | -5.5 | -3.4 | -6.1 | -6.1 | -6.1 | -6.1 | -6.0 |
| Capital Expenditure, % | -1.98 | -2.17 | -1.05 | -1.14 | -0.78618 | -1.43 | -1.43 | -1.43 | -1.43 | -1.43 |
| Tax Rate, % | 317.94 | 317.94 | 317.94 | 317.94 | 317.94 | 317.94 | 317.94 | 317.94 | 317.94 | 317.94 |
| EBITAT | 13.5 | 27.8 | 23.5 | 4.5 | -12.3 | 9.7 | 9.7 | 9.7 | 9.6 | 9.6 |
| Depreciation | ||||||||||
| Changes in Account Receivables | ||||||||||
| Changes in Inventories | ||||||||||
| Changes in Accounts Payable | ||||||||||
| Capital Expenditure | ||||||||||
| UFCF | -22.5 | 87.9 | 73.0 | 71.4 | 17.2 | 27.5 | 50.6 | 50.4 | 50.2 | 49.9 |
| WACC, % | 6.51 | 6.47 | 6.42 | 6.09 | 5.39 | 6.17 | 6.17 | 6.17 | 6.17 | 6.17 |
| PV UFCF | ||||||||||
| SUM PV UFCF | 189.3 | |||||||||
| Long Term Growth Rate, % | 2.00 | |||||||||
| Free cash flow (T + 1) | 51 | |||||||||
| Terminal Value | 1,220 | |||||||||
| Present Terminal Value | 904 | |||||||||
| Enterprise Value | 1,093 | |||||||||
| Net Debt | 16 | |||||||||
| Equity Value | 1,077 | |||||||||
| Diluted Shares Outstanding, MM | 19 | |||||||||
| Equity Value Per Share | 56.41 |
What You Will Get
- Comprehensive Market Analysis: Forrester's extensive research provides accurate insights for strategic planning.
- Full Customization Options: Modify key metrics such as market growth, customer segments, and competitive landscape.
- Real-Time Data Integration: Instant updates allow you to visualize changes as you adjust parameters.
- Professional-Grade Reporting Template: A polished Excel file crafted for high-quality market assessments.
- Flexible and Adaptable: Designed for versatility, enabling repeated use for various market analyses.
Key Features
- Comprehensive Market Insights: Gain access to detailed reports and analyses on industry trends and consumer behavior.
- Tailored Research Solutions: Customize your research focus with options to edit key parameters and metrics.
- Interactive Data Tools: Utilize dynamic models for real-time updates on market forecasts and performance metrics.
- Intuitive Reporting Dashboard: Visualize findings with user-friendly charts and summaries for clearer decision-making.
- Designed for All Levels: An accessible platform suitable for analysts, executives, and strategic planners alike.
How It Works
- Step 1: Download the prebuilt Excel template featuring Forrester Research, Inc. (FORR) data.
- Step 2: Review the pre-filled sheets to familiarize yourself with the essential metrics.
- Step 3: Modify forecasts and assumptions in the editable yellow cells (WACC, growth, margins).
- Step 4: Instantly see the updated results, including Forrester Research, Inc.'s (FORR) intrinsic value.
- Step 5: Make well-informed investment choices or create reports based on the generated outputs.
Why Choose Forrester Research, Inc. (FORR)?
- Save Time: Access comprehensive research reports without the hassle of data collection.
- Enhance Decision-Making: Data-driven insights help you make informed strategic choices.
- Fully Customizable: Tailor research findings to align with your specific business needs.
- Easy to Understand: User-friendly presentations and visualizations simplify complex information.
- Trusted by Leaders: Valued by industry experts for its accuracy and depth of analysis.
Who Should Use This Product?
- Market Researchers: Access comprehensive reports to enhance market analysis for (FORR).
- Corporate Strategy Teams: Utilize insights to inform strategic planning and decision-making.
- Consultants and Advisors: Equip clients with in-depth research findings on industry trends related to (FORR).
- Students and Educators: Leverage real-world case studies to learn about market research methodologies.
- Business Analysts: Gain a deeper understanding of how research impacts business performance in the tech sector.
What the Template Contains
- Pre-Filled Data: Includes Forrester Research’s historical financials and forecasts.
- Discounted Cash Flow Model: Editable DCF valuation model with automatic calculations.
- Weighted Average Cost of Capital (WACC): A dedicated sheet for calculating WACC based on custom inputs.
- Key Financial Ratios: Analyze Forrester Research’s profitability, efficiency, and leverage.
- Customizable Inputs: Edit revenue growth, margins, and tax rates with ease.
- Clear Dashboard: Charts and tables summarizing key valuation results.
Disclaimer
All information, articles, and product details provided on this website are for general informational and educational purposes only. We do not claim any ownership over, nor do we intend to infringe upon, any trademarks, copyrights, logos, brand names, or other intellectual property mentioned or depicted on this site. Such intellectual property remains the property of its respective owners, and any references here are made solely for identification or informational purposes, without implying any affiliation, endorsement, or partnership.
We make no representations or warranties, express or implied, regarding the accuracy, completeness, or suitability of any content or products presented. Nothing on this website should be construed as legal, tax, investment, financial, medical, or other professional advice. In addition, no part of this site—including articles or product references—constitutes a solicitation, recommendation, endorsement, advertisement, or offer to buy or sell any securities, franchises, or other financial instruments, particularly in jurisdictions where such activity would be unlawful.
All content is of a general nature and may not address the specific circumstances of any individual or entity. It is not a substitute for professional advice or services. Any actions you take based on the information provided here are strictly at your own risk. You accept full responsibility for any decisions or outcomes arising from your use of this website and agree to release us from any liability in connection with your use of, or reliance upon, the content or products found herein.