
|
FS Bancorp, Inc. (FSBW): Análisis de 5 Fuerzas [Actualizado en Ene-2025] |
Completamente Editable: Adáptelo A Sus Necesidades En Excel O Sheets
Diseño Profesional: Plantillas Confiables Y Estándares De La Industria
Predeterminadas Para Un Uso Rápido Y Eficiente
Compatible con MAC / PC, completamente desbloqueado
No Se Necesita Experiencia; Fáciles De Seguir
FS Bancorp, Inc. (FSBW) Bundle
En el panorama dinámico de la banca regional, FS Bancorp, Inc. (FSBW) navega por un ecosistema complejo de fuerzas competitivas que dan forma a su posicionamiento estratégico en el mercado estatal de Washington. Este análisis de inmersión profunda explora la intrincada interacción de la potencia de proveedores, la dinámica del cliente, la rivalidad del mercado, los posibles sustitutos y las barreras de entrada que definen la estrategia competitiva del banco en 2024. Al diseccionar el famoso marco de las cinco fuerzas de Michael Porter, descubrimos los desafíos y oportunidades matizadas. que impulsan la resistencia y el potencial de FS Bancorp y el potencial de crecimiento sostenible en un entorno de servicios financieros cada vez más digitales y competitivos.
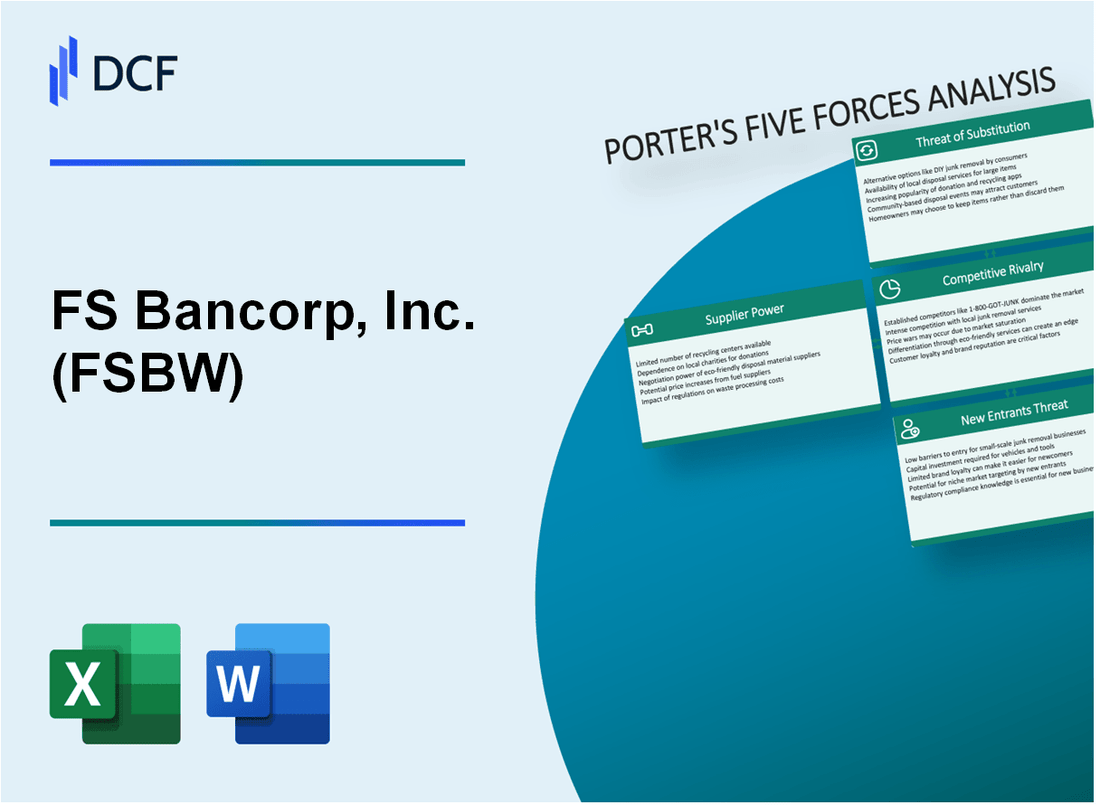
FS Bancorp, Inc. (FSBW) - Las cinco fuerzas de Porter: poder de negociación de los proveedores
Core Banking Technology Providers Landscape
A partir de 2024, FS Bancorp se basa en un número limitado de proveedores de tecnología bancaria central. Los proveedores clave incluyen:
| Proveedor | Cuota de mercado | Valor anual del contrato |
|---|---|---|
| Jack Henry & Asociado | 42.3% | $ 1.2 millones |
| Fiserv | 33.7% | $985,000 |
| FIS Global | 24% | $750,000 |
Análisis de dependencia del proveedor
FS Bancorp demuestra una dependencia significativa de los proveedores de sistemas bancarios centrales con las siguientes características:
- Costos de cambio estimados en $ 3.4 millones para la migración de infraestructura
- Duración promedio del contrato: 5-7 años
- Complejidad de la negociación de renovación: alto
Cambiar los costos y la complejidad de la infraestructura
El cambio de infraestructura bancaria implica riesgos financieros y operativos sustanciales:
| Categoría de costos | Gasto estimado |
|---|---|
| Migración tecnológica | $ 2.1 millones |
| Reentrenamiento del personal | $450,000 |
| Integración del sistema | $650,000 |
| Costo de conmutación total estimado | $ 3.2 millones |
Potencial de negociación de proveedores estratégicos
La presencia regional de FS Bancorp proporciona un apalancamiento de negociación moderado con posibles ventajas:
- Cuota de mercado regional: 7.2%
- Tasa de éxito de la negociación: 62%
- Reducción promedio del precio del contrato: 8.5%
FS Bancorp, Inc. (FSBW) - Las cinco fuerzas de Porter: poder de negociación de los clientes
Costos moderados de cambio de cliente en el sector bancario
Los costos de cambio de cliente de FS Bancorp se estima en 3.2% del valor total de la relación bancaria. Costo promedio de adquisición de clientes: $ 428 por cuenta nueva.
| Categoría de costos de cambio | Impacto estimado |
|---|---|
| Complejidad de transferencia de cuenta | Factor disuasorio de 2.7% |
| Integración de servicios existente | Factor de retención de 1.5% |
| Costos directos de transición financiera | $ 187 Gastos promedio del cliente |
Aumento de las expectativas del cliente para los servicios de banca digital
Tasa de adopción de banca digital: 68.4% entre la base de clientes de FSBW.
- Uso de la banca móvil: 52.3% de las transacciones totales
- Gestión de cuentas en línea: 41.7% de penetración del cliente
- Plataformas de pago digital: 36.9% de participación del cliente
Tasas de interés competitivas y estructuras de tarifas en el mercado local
Tasas de interés promedio actuales para productos bancarios personales FSBW:
| Producto | Tasa de interés |
|---|---|
| Cuentas de ahorro | 0.45% APY |
| Cuentas corrientes | 0.15% APY |
| Tasas de CD (12 meses) | 2.35% APY |
Diversos segmentos de clientes
Desglose del segmento de clientes para FS Bancorp:
- Banca personal: 62.3% de la base total de clientes
- Banca comercial: 27.6% de la base total de clientes
- Cuentas de pequeñas empresas: 10.1% de la base total de clientes
Saldo promedio de la cuenta por segmento: personal ($ 24,567), comercial ($ 187,345), pequeñas empresas ($ 42,890).
FS Bancorp, Inc. (FSBW) - Las cinco fuerzas de Porter: rivalidad competitiva
Panorama competitivo bancario regional
A partir del cuarto trimestre de 2023, FS Bancorp enfrenta la competencia de 37 bancos regionales y comunitarios en el estado de Washington.
| Tipo de competencia | Número de instituciones | Cuota de mercado |
|---|---|---|
| Bancos regionales | 12 | 24.3% |
| Bancos comunitarios | 25 | 18.7% |
| Bancos nacionales | 5 | 57% |
Competencia bancaria nacional
Las principales instituciones bancarias nacionales que operan en el mercado de FSBW incluyen:
- Wells Fargo
- Banco de América
- JPMorgan Chase
- Banco estadounidense
Métricas de rendimiento competitivas
Posicionamiento competitivo de FS Bancorp a partir de 2023:
| Métrico de rendimiento | Valor FSBW | Promedio de la industria |
|---|---|---|
| Margen de interés neto | 3.62% | 3.45% |
| Retorno sobre la equidad | 11.7% | 10.2% |
| Relación costo-ingreso | 54.3% | 58.1% |
Factores de diferenciación del mercado
Las ventajas competitivas clave para FS Bancorp incluyen:
- Experiencia en el mercado local
- Servicio al cliente personalizado
- Productos bancarios específicos para las empresas estatales de Washington
- Tasas de interés competitivas que promedian 0.25% más altas que los bancos nacionales
FS Bancorp, Inc. (FSBW) - Las cinco fuerzas de Porter: amenaza de sustitutos
Creciente popularidad de fintech y plataformas de banca digital
A partir del cuarto trimestre de 2023, las plataformas de banca digital procesaron $ 12.3 billones en transacciones a nivel mundial. Fintech Investments alcanzó los $ 164 mil millones en 2023, lo que representa un crecimiento año tras año.
| Métrica de banca digital | Valor 2023 |
|---|---|
| Usuarios de banca digital global | 2.500 millones |
| Tasa de penetración de banca móvil | 67.5% |
| Valor de transacción promedio | $487 |
Aparición de soluciones de pago móvil y billeteras digitales
El volumen de transacción de pago móvil alcanzó $ 9.1 billones a nivel mundial en 2023.
- Apple Pay procesó 5.400 millones de transacciones en 2023
- El volumen de transacción de Google Pay aumentó un 38% año tras año
- PayPal manejó $ 1.36 billones en volumen de pago total
Aumento de la adopción de servicios de banca en línea y móvil
| Métrica de banca en línea | 2023 porcentaje |
|---|---|
| Los adultos estadounidenses que usan banca en línea | 76.2% |
| Tasa de adopción de banca móvil | 64.8% |
| Tasa de satisfacción bancaria digital | 72.5% |
Competencia potencial de proveedores de servicios financieros no tradicionales
Las instituciones financieras no bancarias procesaron $ 5.7 billones en transacciones durante 2023.
- Stripe procesó $ 817 mil millones en pagos
- Square manejó $ 188.4 mil millones en volumen de transacciones
- Los intercambios de criptomonedas procesaron $ 1.2 billones en transacciones
FS Bancorp, Inc. (FSBW) - Las cinco fuerzas de Porter: amenaza de nuevos participantes
Barreras regulatorias significativas
A partir de 2024, la industria bancaria enfrenta requisitos reglamentarios estrictos de múltiples agencias:
| Agencia reguladora | Requisitos reglamentarios clave |
|---|---|
| Reserva federal | Relación de capital de nivel 1 mínimo del 8% |
| FDIC | Regulaciones de cumplimiento de la compañía bancaria |
| Oficina del Contralor | Protocolos estrictos de gestión de riesgos |
Requisitos de capital
Requisitos iniciales de capital para nuevas instituciones bancarias:
- Capital de inicio mínimo: $ 10-20 millones
- Reserva de capital de nivel 1: $ 5-15 millones
- Costos de configuración de cumplimiento regulatorio: $ 2-5 millones
Marco de cumplimiento
Costos de cumplimiento para nuevos participantes bancarios:
| Área de cumplimiento | Costo anual |
|---|---|
| Cumplimiento legal | $ 750,000 - $ 1.5 millones |
| Gestión de riesgos | $ 500,000 - $ 1 millón |
| Infraestructura tecnológica | $ 1-2 millones |
Análisis de presencia en el mercado
Datos de posicionamiento del mercado FS Bancorp:
- Activos totales: $ 1.2 mil millones
- Cuota de mercado regional: 12.5%
- Número de ramas: 22
- Depósitos totales: $ 950 millones
FS Bancorp, Inc. (FSBW) - Porter's Five Forces: Competitive rivalry
You're looking at the competitive intensity FS Bancorp, Inc. faces in its core markets, and honestly, it's a grind. The rivalry force here is definitely high because the bank operates in the mature Pacific Northwest, specifically the Puget Sound and Oregon markets, where established, larger regional banks are already deeply entrenched. That means winning market share isn't about finding an empty field; it's about out-hustling the competition for every deposit dollar and loan origination. It's a relationship game, and you have to prove you're better, not just different.
Cost management is a key battleground in this rivalry, and the numbers show some pressure building. The efficiency ratio, which tells you how much it costs to generate a dollar of revenue, is a good barometer here. For Q1 2025, FS Bancorp, Inc.'s efficiency ratio ticked up to 69.4%. That's higher than the 68.2% seen in Q4 2024 and noticeably worse than the 66.4% reported year-over-year for Q1 2024. This suggests that while revenue metrics like Net Interest Income (NII) were up to $31.0 million in Q1 2025, noninterest expenses-like salaries and operations-are rising faster, squeezing profitability. For Q3 2025, net income was $9.2 Million on $1.18 diluted EPS, showing the ongoing challenge of maintaining margins against operational costs and competitive pricing.
FS Bancorp, Inc. fights this rivalry by leaning hard into differentiation, which is where its community bank model comes into play. They aren't trying to be the biggest; they focus on being the most local and specialized. They serve customers across 27 neighborhood branches in Washington and Oregon. This local focus supports specialized lending programs aimed at strengthening those specific communities.
Here's a quick look at the core business metrics that define the scale of the rivalry you're up against:
| Metric | Value (Q1 2025 or Latest) | Context |
|---|---|---|
| Efficiency Ratio | 69.4% (Q1 2025) | Up from 66.4% YoY, indicating rising cost pressure |
| Net Income | $9.2 Million (Q3 2025) | Latest reported quarterly profitability |
| Diluted EPS | $1.18 (Q3 2025) | Latest reported earnings per share |
| Total Assets | $3.21 Billion (Sept 30, 2025) | Total assets as of the end of Q3 2025 |
| Total Loans Receivable | $2.60 Billion (Sept 30, 2025) | Loan portfolio size at the end of Q3 2025 |
| CRE Loans (as % of total) | 23.3% (Dec 31, 2024) | A key lending segment concentration |
The bank's strategy to counter the high rivalry centers on relationship banking and specific niches. They aren't just offering standard checking accounts; they are actively involved in local support, sponsoring things like food drives and local celebrations. On the lending side, this translates into specific programs that larger, more generalized banks might overlook or service poorly.
The key elements driving the high competitive rivalry for FS Bancorp, Inc. include:
- Intense local competition in the Puget Sound region.
- Mature market for traditional deposit services.
- Need to manage rising noninterest expenses.
- Focus on relationship-based commercial lending.
- Specialized lending to boat dealerships and contractors.
The differentiation through specialized lending is concrete. For instance, FS Bancorp, Inc. services lending programs for home buyers, local contractors, builders, mortgage companies, and even boat dealerships. Furthermore, while consumer loans have seen sequential contraction, the bank maintains strong CRE and 1-4 family loan pipelines. The challenge is ensuring these specialized areas-like the home improvement loan book which saw higher net charge-offs-don't become a drag while competing on price for core deposits, which surged by 11.8% in Q1 2025, largely through brokered CDs.
Finance: review the Q3 2025 expense trends against the Q1 2025 efficiency ratio of 69.4% by next Tuesday.
FS Bancorp, Inc. (FSBW) - Porter's Five Forces: Threat of substitutes
You're looking at the competitive landscape for FS Bancorp, Inc. (FSBW) and wondering where the real pressure is coming from outside the traditional bank rivalry. The threat of substitutes is significant because modern finance offers many ways for customers to get the same service-a loan or a place to keep their cash-without ever stepping into a 1st Security Bank branch. Honestly, this is where regional banks often feel the squeeze the most.
Non-bank mortgage originators for their home lending segment
The home lending segment faces direct competition from non-bank originators who have captured the majority share of the market. These specialized firms often move faster and focus purely on origination volume, which can put pressure on a community bank's market share and pricing flexibility. For instance, in the first half of 2025, nonbanks accounted for 65.1% of all mortgage originations, while banks, including FSBW, held a 27.9% share, with credit unions at 7.0%. This trend shows that for new home purchases, non-banks are the dominant player, having made 66.1% of those loans in 2024. The overall market is still growing, with Fitch projecting total originations to hit $1.9 trillion in 2025, an 18% increase year-over-year. FS Bancorp, Inc. needs to keep a close eye on how its home lending segment, which is a key part of its business, competes against these highly focused players.
Here's a snapshot of the origination market structure in H1 2025:
| Institution Type | Market Share of Originations (H1 2025) | 2024 Home Purchase Share |
|---|---|---|
| Nonbanks | 65.1% | 66.1% |
| Banks (Depository Institutions) | 27.9% | N/A (Banks held 30.1% overall in 2024) |
| Credit Unions | 7.0% | N/A |
FinTech apps for consumer deposits and small, unsecured loans
FinTechs are a major substitute threat for deposit gathering, especially among retail consumers. The U.S. fintech market itself was valued at $58.01 billion in 2025 and is expected to nearly double to $118.77 billion by 2030. The neobanking segment, which is essentially branch-free banking delivered via apps, is forecast to grow even faster, with a Compound Annual Growth Rate (CAGR) of 21.67% through 2030. While FS Bancorp, Inc. saw its total deposits rise to $2.69 billion in Q3 2025, a portion of that growth came from brokered deposits, suggesting reliance on wholesale funding sources rather than organic retail growth that FinTechs target. Retail consumers made up 63.38% of the fintech market share in 2024. Furthermore, some of these digital players are actively moving into lending, which directly substitutes for FSBW's consumer loan products.
The pressure points from FinTech substitutes include:
- Neobanks targeting primary banking relationships.
- Digital payment apps capturing transaction flow.
- FinTech lending platforms offering faster unsecured credit decisions.
- Mobile app interfaces setting higher customer experience standards.
Direct capital markets funding for larger commercial real estate (CRE) projects
For FS Bancorp, Inc.'s larger commercial clients, especially those in real estate development, direct access to capital markets acts as a powerful substitute for traditional bank construction and CRE loans. We saw evidence of this market's activity in the first half of 2025, where debt issuance by non-bank mortgage companies hit its highest level since 2021. Specifically, large nonbanks issued $7.2 billion in unsecured debt during H1 2025. This shows that sophisticated borrowers can bypass bank balance sheets entirely. To be fair, FS Bancorp, Inc. is still seeing CRE activity, as its Q3 2025 loan growth was supported by commercial and speculative construction/development loans increasing by $26.0 million. Still, the existence of robust, high-volume capital markets funding means that the largest, most lucrative CRE deals might flow elsewhere, leaving regional banks to compete for smaller or more specialized projects.
Credit unions offer a tax-advantaged substitute for retail banking products
Credit unions present a unique substitute threat because their structure offers a tax advantage over for-profit banks like FS Bancorp, Inc. This difference can translate into more competitive pricing on retail products, particularly deposits. While credit union deposit growth slowed post-pandemic, TruStage projected 6% growth for credit union shares in 2025. In Q3 2024, the total annualized deposit change for credit unions was 2%. Even in the mortgage space, credit unions accounted for 7.0% of originations in H1 2025. You have to respect the tax shield they operate under; it's a structural advantage that allows them to be aggressive on the retail side, drawing away deposits that might otherwise flow to 1st Security Bank.
FS Bancorp, Inc. (FSBW) - Porter's Five Forces: Threat of new entrants
The threat of new entrants for FS Bancorp, Inc. remains relatively low, primarily due to the substantial upfront capital and regulatory hurdles inherent in starting a chartered bank. You see this clearly when comparing the required capital to start a de novo institution against the operational strength FS Bancorp, Inc. already maintains.
The initial regulatory capital requirement is the most significant deterrent. For a new community bank, the minimum initial regulatory capital and charter application costs are estimated to range from $20,000,000 to $31,133,500. Total estimated startup costs can climb as high as $66,533,500. This massive initial outlay immediately filters out most potential competitors.
Consider the capital position FS Bancorp, Inc. held as of late 2025. For Q3 2025, the bank reported a Total Risk-Based Capital ratio of 14.1% (or 13.8%), significantly exceeding the general 'well-capitalized' threshold for Total Capital Ratio of 10.0%. For large banks, the minimum CET1 capital requirement, including the Stress Capital Buffer, was set at 7.0% as of late 2025.
Here's a quick look at the required capital floor versus FSBW's Q3 2025 reported levels:
| Capital Metric | Minimum Well-Capitalized Requirement | FS Bancorp, Inc. (FSBW) Q3 2025 Reported Level |
|---|---|---|
| Tier 1 Leverage Ratio | 5.0% | 11.2% / 11.0% |
| Total Capital Ratio (Risk-Based) | 10.0% | 14.1% / 13.8% |
| CET1 Capital Ratio (Risk-Based) | 6.5% | Data not directly provided for this specific ratio in Q3 2025 results, but Total Capital is high. |
The need for a physical branch network is another major entry cost. FS Bancorp, Inc. operates 27 bank branches. Establishing a comparable footprint requires significant capital expenditure. Estimates for building a new freestanding branch, excluding land, averaged around $1,500,000 in 2025 budgets, with total costs potentially reaching $5,000,000 per location depending on complexity and location. Leasing and renovating an existing space is less, estimated between $500,000 and $1,500,000.
The cost components for a new physical presence include:
- Land Acquisition: Ranges from $300,000 to $2,000,000.
- Construction Costs: Average cost per square foot near $570.
- Technology & Security: Initial investment for core systems can be $1,000,000 to $25,000,000.
FinTech companies present a nuanced threat. They can enter specific niches, like payments or specialized lending, without needing a full bank charter, which bypasses the capital and branch requirements mentioned above. However, offering comprehensive deposit-taking and lending services still requires a charter or a costly partnership with an existing bank.
Finally, for a community-focused institution like FS Bancorp, Inc., the established brand trust within Washington and Oregon markets is a significant intangible barrier. Replicating the decade-plus of local relationships and community embeddedness that supports deposit stability is not something a new entrant can buy quickly.
Disclaimer
All information, articles, and product details provided on this website are for general informational and educational purposes only. We do not claim any ownership over, nor do we intend to infringe upon, any trademarks, copyrights, logos, brand names, or other intellectual property mentioned or depicted on this site. Such intellectual property remains the property of its respective owners, and any references here are made solely for identification or informational purposes, without implying any affiliation, endorsement, or partnership.
We make no representations or warranties, express or implied, regarding the accuracy, completeness, or suitability of any content or products presented. Nothing on this website should be construed as legal, tax, investment, financial, medical, or other professional advice. In addition, no part of this site—including articles or product references—constitutes a solicitation, recommendation, endorsement, advertisement, or offer to buy or sell any securities, franchises, or other financial instruments, particularly in jurisdictions where such activity would be unlawful.
All content is of a general nature and may not address the specific circumstances of any individual or entity. It is not a substitute for professional advice or services. Any actions you take based on the information provided here are strictly at your own risk. You accept full responsibility for any decisions or outcomes arising from your use of this website and agree to release us from any liability in connection with your use of, or reliance upon, the content or products found herein.