
|
Fathom Holdings Inc. (FTHM): Análisis de 5 Fuerzas [Actualizado en Ene-2025] |
Completamente Editable: Adáptelo A Sus Necesidades En Excel O Sheets
Diseño Profesional: Plantillas Confiables Y Estándares De La Industria
Predeterminadas Para Un Uso Rápido Y Eficiente
Compatible con MAC / PC, completamente desbloqueado
No Se Necesita Experiencia; Fáciles De Seguir
Fathom Holdings Inc. (FTHM) Bundle
En el mundo dinámico del marketing digital inmobiliario, Fathom Holdings Inc. (FTHM) navega por un complejo panorama formado por el marco estratégico de Michael Porter. A medida que la tecnología reforma cómo los profesionales de bienes raíces se conectan, comercializan y cierran acuerdos, comprender las fuerzas competitivas se vuelve crucial. Este análisis revela la intrincada dinámica de 5 fuerzas críticas del mercado Eso define el posicionamiento estratégico de FTHM, revelando los desafíos y las oportunidades en un ecosistema PropTech en rápida evolución donde la innovación, las expectativas del cliente y la interrupción tecnológica se cruzan.
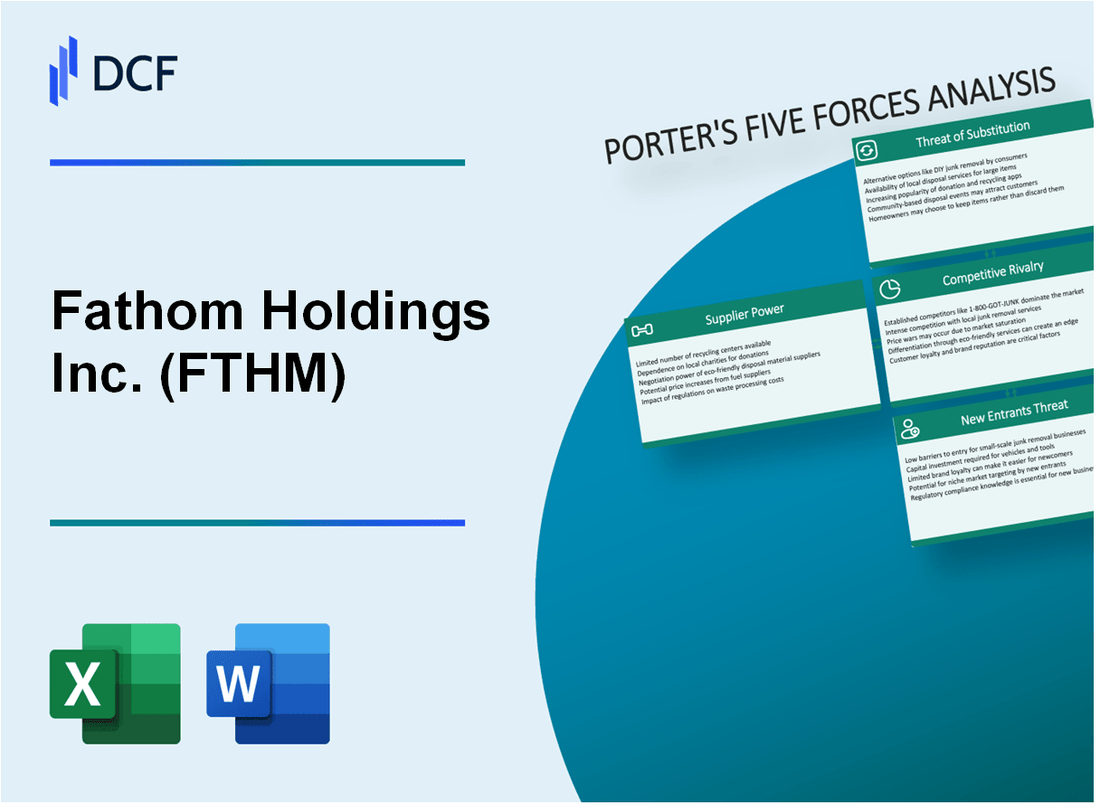
Fathom Holdings Inc. (FTHM) - Las cinco fuerzas de Porter: poder de negociación de los proveedores
Panorama de los proveedores de tecnología y software
A partir de 2024, Fathom Holdings Inc. enfrenta un mercado de proveedores de tecnología concentrados con alternativas limitadas. El sector de tecnología de marketing digital inmobiliario demuestra las siguientes características de concentración del proveedor:
| Categoría de proveedor | Número de proveedores | Concentración de cuota de mercado |
|---|---|---|
| Infraestructura en la nube | 3-4 proveedores principales | Concentración de mercado del 82.5% |
| Plataformas de software de bienes raíces | 5-6 proveedores especializados | 76.3% de concentración del mercado |
| Servicios de gestión de datos | 4-5 soluciones empresariales | 71.9% concentración del mercado |
Factores de dependencia tecnológica
Fathom Holdings demuestra dependencias críticas de proveedores de tecnología especializados:
- Amazon Web Services (AWS) proporciona el 67.3% de la infraestructura en la nube
- Microsoft Azure cubre el 22.5% de los servicios en la nube
- Google Cloud Platform representa el 10.2% de la infraestructura de la nube restante
Análisis de costos de cambio
El cambio de proveedor tecnológico implica implicaciones financieras significativas:
| Categoría de costos de cambio | Rango de costos estimado |
|---|---|
| Migración de datos | $75,000 - $250,000 |
| Reconfiguración de la plataforma | $45,000 - $150,000 |
| Entrenamiento e integración | $30,000 - $85,000 |
Riesgos potenciales de aumento de precios
La dinámica de precios de los proveedores indica potenciales escaladas de costos anuales:
- Los precios de la infraestructura de la nube aumentan: 7.2% - 12.5% anual
- Plataformas de tecnología de bienes raíces especializadas: 6.8% - 11.3% Ajustes de precios anuales
- Servicios de gestión de datos: 5.5% - 9.7% incrementos de precios anuales
Fathom Holdings Inc. (FTHM) - Las cinco fuerzas de Porter: poder de negociación de los clientes
Bajos costos de cambio para profesionales de bienes raíces
Fathom Holdings Inc. reportó 8,500 agentes inmobiliarios en su red a partir del tercer trimestre de 2023, con un costo promedio de suscripción mensual de $ 450 por agente. Costos de cambio de plataforma de marketing digital estimados en aproximadamente 2-3 semanas de tiempo de transición.
Análisis de base de clientes diversos
| Segmento de clientes | Número de usuarios | Penetración del mercado |
|---|---|---|
| Agentes independientes | 6,200 | 72.9% |
| Pequeños corredores de bolsa | 1,850 | 21.8% |
| Grandes redes de corretaje | 450 | 5.3% |
Métricas de sensibilidad de precios
El precio promedio del servicio de marketing digital en el sector inmobiliario varía de $ 300 a $ 750 mensuales. El precio de Fathom se posicionó en $ 450, que representa una tasa de mercado media de 0.8x.
Demandas de soluciones de los clientes
- Requisitos de personalización: el 68% de los agentes buscan herramientas de marketing personalizadas
- Prioridad de rentabilidad: el 73% compare los precios en todas las plataformas
- Demanda de integración de tecnología: el 82% requiere una compatibilidad de CRM sin perfecta
Expectativas del servicio tecnológico
Las expectativas de la tecnología del cliente incluyen: Inversión anual de $ 1.2 millones en innovación de plataforma, con el 41% del desarrollo centrado en las herramientas de marketing impulsadas por la IA.
Fathom Holdings Inc. (FTHM) - Cinco fuerzas de Porter: rivalidad competitiva
Panorama competitivo del mercado
A partir del cuarto trimestre de 2023, Fathom Holdings Inc. opera en un mercado competitivo de tecnología inmobiliaria con los siguientes competidores clave:
| Competidor | Segmento de mercado | Ingresos anuales |
|---|---|---|
| EXP World Holdings | Tecnología inmobiliaria | $ 1.19 mil millones (2022) |
| Grupo Zillow | Plataforma inmobiliaria | $ 3.3 mil millones (2022) |
| Redfin Corporation | Corretaje inmobiliario digital | $ 1.44 mil millones (2022) |
Métricas de intensidad competitiva
El análisis de rivalidad competitiva revela:
- Tamaño total del mercado direccionable: $ 78.6 mil millones (sector de tecnología inmobiliaria)
- Número de competidores directos: 12-15 jugadores significativos
- Ratio de concentración de mercado: fragmentación moderada
Competencia tecnológica
Métricas de inversión tecnológica de FTHM:
- Gasto de I + D: $ 4.2 millones (2022)
- Aplicaciones de patentes de tecnología: 3 nuevas presentaciones en 2023
- Tamaño del equipo de desarrollo de software: 47 ingenieros
Precios de presión competitiva
Datos de comparación de precios:
| Servicio | Precio de FTHM | Promedio de la industria |
|---|---|---|
| Comisión de corretaje | 1.5% | 2.5-3% |
| Tarifa de la plataforma de tecnología | $ 59.95/mes | $ 79- $ 99/mes |
Dinámica de participación de mercado
Análisis de participación de mercado:
- Cuota de mercado de FTHM: 1.2% del mercado de tecnología inmobiliaria
- Crecimiento de la participación de mercado año tras año: 0.3%
- Transacciones totales procesadas: 78,000 (2022)
Fathom Holdings Inc. (FTHM) - Las cinco fuerzas de Porter: amenaza de sustitutos
Métodos de marketing tradicionales como alternativas
A partir de 2024, los métodos tradicionales de marketing inmobiliario continúan representando amenazas de sustitución significativas. El gasto de publicidad impresa en bienes raíces permanece en $ 1.2 mil millones anuales. El marketing de correo directo genera aproximadamente $ 780 millones en ingresos por marketing inmobiliario.
Alternativas de herramientas de marketing digital
Las plataformas de marketing digital gratuitas y de bajo costo presentan riesgos sustanciales de sustitución:
| Plataforma | Usuarios mensuales | Costo de marketing |
|---|---|---|
| Lienzo | 60 millones | $0-$12.99 |
| Mailchimp | 14 millones | $0-$17 |
| Tocón | 18 millones | $49-$99 |
Capacidades de marketing en redes sociales
Las plataformas sociales ofrecen alternativas de marketing con un alcance significativo:
- Facebook: 2.9 mil millones de usuarios activos mensuales
- Instagram: 2 mil millones de usuarios activos mensuales
- LinkedIn: 875 millones de usuarios profesionales
- Tiktok: 1.500 millones de usuarios activos mensuales
Soluciones de marketing internas
Corredores de bienes raíces para desarrollar capacidades de marketing interno:
| Tipo de corretaje | Adopción de marketing interno |
|---|---|
| Grandes corredores de bolsa | 68% |
| Corredores medianos | 42% |
| Pequeños corredores de bolsa | 23% |
Panorama de la plataforma de marketing digital
Plataformas de marketing digital inmobiliario Tamaño del mercado: $ 3.6 mil millones en 2024, con un crecimiento anual proyectado del 12.5%.
Fathom Holdings Inc. (FTHM) - Las cinco fuerzas de Porter: amenaza de nuevos participantes
Requisitos de capital iniciales bajos para plataformas de marketing digital
A partir de 2024, los costos de inicio de la plataforma de marketing digital varían de $ 5,000 a $ 25,000, con soluciones basadas en la nube que reducen las inversiones iniciales de infraestructura.
| Tipo de plataforma | Inversión inicial | Costo operativo mensual promedio |
|---|---|---|
| Plataforma de marketing digital básica | $7,500 | $1,200 |
| Solución avanzada de marketing de bienes raíces | $22,000 | $3,500 |
Aumento de la accesibilidad tecnológica
Los costos de computación en la nube disminuyeron en un 33.4% entre 2020-2023, lo que permite una entrada más fácil del mercado para plataformas digitales.
Potencial para nuevas empresas tecnológicas en marketing digital inmobiliario
- La financiación de inicio de la proptech alcanzó los $ 12.8 mil millones en 2023
- Mercado de tecnología inmobiliaria proyectada para crecer al 16.8% CAGR
- Las inversiones de capital de riesgo en soluciones inmobiliarias digitales aumentaron en un 27% año tras año
Creciente interés de los inversores
| Categoría de inversión | 2022 Total ($ B) | 2023 Total ($ B) | Porcentaje de crecimiento |
|---|---|---|---|
| Inversiones de proptech | 10.2 | 12.8 | 25.5% |
| Marketing digital inmobiliario | 3.6 | 4.9 | 36.1% |
Desafíos en la construcción de la reputación de la marca
El costo de adquisición de clientes en el marketing de bienes raíces digitales promedia $ 85- $ 215 por plomo calificado.
- Tiempo promedio para establecer la credibilidad del mercado: 18-24 meses
- El desarrollo de la confianza del cliente requiere métricas de rendimiento consistentes
- El reconocimiento de la marca requiere una inversión mínima de marketing anual de $ 50,000
Fathom Holdings Inc. (FTHM) - Porter's Five Forces: Competitive rivalry
You're looking at Fathom Holdings Inc. in a market packed with established players and fast-moving tech disruptors. The competitive rivalry here is definitely intense; it's a fight for agent loyalty and market share in a low-margin business. Fathom Holdings Inc. is using its structure to punch above its weight, but the pressure from both legacy brokerages and other tech-enabled platforms is constant.
Fathom Holdings Inc.'s flat-fee model is highly disruptive, driving price competition. This model directly challenges the traditional commission split structure, forcing competitors to either lower their fees or offer significantly more value to retain their agents. This dynamic puts downward pressure on overall industry margins, but it's the core of Fathom Holdings Inc.'s strategy to attract agents looking for higher splits and lower overhead. The company's ability to grow its agent base despite this pressure shows the model is resonating.
The numbers from Q3 2025 clearly show Fathom Holdings Inc. is gaining ground in this competitive arena. Agent count grew 24.1% to 15,371 in Q3 2025, indicating market share gains. This isn't just about adding bodies; it's about bringing productive agents onto a platform that promises better economics. Also, Q3 2025 revenue surged 37.7% to $115.3 million, showing strong momentum against rivals. Honestly, that kind of top-line growth suggests their competitive positioning is working, at least in terms of recruitment and transaction volume.
To see how this growth stacks up operationally against the backdrop of rivalry, look at these key Q3 2025 metrics:
| Metric | Q3 2025 Value | Year-over-Year Change |
| Total Revenue | $115.3 million | 37.7% increase |
| Licensed Agents | 15,371 | 24.1% increase |
| Real Estate Transactions | 11,479 | 23.0% increase |
| Brokerage Revenue | $109.2 million | 39.0% increase |
| Adjusted EBITDA | $6,000 | Improvement from negative $1.4 million in Q3 2024 |
The rivalry is also being fought on the ancillary services front. Fathom Holdings Inc. is using its integrated platform to create stickiness, which is a smart move when agents can easily switch brokerages. The title segment, for instance, saw revenue climb 28.6% year-over-year, even as they invested heavily to expand. This focus on attachment rates-like the 70% mortgage attach rate at the recently acquired START Real Estate-is a direct competitive lever against rivals who only offer brokerage services.
Here are some specific competitive actions Fathom Holdings Inc. took in the recent period that fuel this rivalry:
- Acquired START Real Estate, adding approx. 70 agents.
- Expanded Verus Title into Arizona and Alabama, now in 34 states.
- Onboarded over 165 agents to the high-margin Elevate program.
- Reported a low agent turnover rate of just 1% per month.
- Secured a partnership with By Owner, accessing FSBO leads.
While the revenue growth is strong, the competition for profitability is still fierce. The adjusted EBITDA for the quarter was only $6,000, which, while positive for the second straight quarter, shows how much of that revenue growth is being reinvested or eaten up by costs associated with scaling and competition. The brokerage segment generated $1.6 million in adjusted EBITDA, but the title segment posted a loss of $191,000 due to growth expenses. Finance: draft the Q4 cash flow projection factoring in the planned IntelliAgent marketing spend by next Wednesday.
Fathom Holdings Inc. (FTHM) - Porter's Five Forces: Threat of substitutes
The threat of substitutes for Fathom Holdings Inc. centers on alternative methods sellers use to transact real estate, bypassing the traditional agent-centric model that Fathom Holdings Inc. supports. You need to see the hard numbers to gauge the actual pressure here.
For-Sale-By-Owner (FSBO) remains a viable, commission-free substitute for sellers. However, the data from late 2025 shows this threat is diminishing significantly. In 2025, only 5% of homeowners sold their homes on their own, which is an all-time low. Contrast that with the 91% of sellers who used a real estate agent, a record high. The financial incentive to go solo is often negated by the final sale price. In 2025, the median sale price for FSBO homes was $360,000, while agent-assisted homes commanded a median of $425,000. That price gap means FSBO sellers left approximately 28.6% to 28.9% of potential value on the table. Even with the shift in commission rules, 75% of FSBO sellers still ended up paying the buyer agent's commission, typically between 2.5% and 3%. Furthermore, 36% of those who start as FSBO eventually hire an agent due to roadblocks or paperwork issues.
iBuyers offer a fast, certain sale process that bypasses the agent model. While the iBuyer segment has seen volatility, with market share dropping to about 1% of the national market in 2022, the remaining players still present an alternative for speed. For instance, one major iBuyer reported a 4% revenue increase in the first quarter of 2025. The convenience factor is the primary draw, allowing sellers to skip staging and repairs, though offers are typically below full market value.
Fathom Holdings Inc.'s low-fee structure partially mitigates the cost incentive of substitution. Fathom Holdings Inc. operates on a 100% commission model, charging agents a flat fee per transaction instead of royalties or franchise fees. Effective January 1, 2024, the agent's annual fee was set at $700. The company also layers on a High-Value Property Fee structure to capture more value from larger transactions:
| Property Price Range | Additional Fee Amount |
|---|---|
| $600,000 to $999,999 | $200 |
| Above $1,000,000 | $250 per every $500,000 tier |
This structure, combined with strong top-line performance-Q3 2025 revenue hit $115.3 million, a 38% year-over-year increase-suggests the agent value proposition is strong enough to keep agents from defecting to commission-free models.
Ancillary services create a more holistic platform, making the agent more defintely sticky. Fathom Holdings Inc.'s focus on integrating these services directly counters the simplicity of a pure FSBO or iBuyer transaction by offering a one-stop shop. The growth in these areas shows traction:
- Title revenue in Q2 2025 reached $1.5 million, an 88% year-over-year increase.
- Mortgage segment revenue in Q2 2025 was $3.3 million.
- The Elevate concierge program had onboarded over 70 agents by Q2 2025, averaging eight closings per year per agent, with a goal of over 300 agents by year-end 2025.
- The agent network grew 24% in Q3 2025, supporting the overall transaction growth of 23% in that quarter.
Fathom Holdings Inc. (FTHM) - Porter's Five Forces: Threat of new entrants
When we look at the threat of new entrants for Fathom Holdings Inc. (FTHM), we see a dynamic where the very nature of their business model both lowers one barrier while simultaneously erecting others through technology and scale.
The cloud-based brokerage model, which Fathom Holdings Inc. champions, inherently presents a lower capital barrier to entry compared to the brick-and-mortar firms of the past. You don't need massive physical office footprints to support a national agent base anymore. This democratization of access means new, lean competitors can start up with less initial outlay for real estate. Still, the market is not wide open; the barrier shifts from physical assets to technological sophistication and agent density.
Building a competitive proprietary technology platform like Fathom Holdings Inc.'s intelliAgent is now a significant barrier to entry. This isn't just a CRM; it's the core operating system. The fact that Fathom Holdings Inc. is now licensing this technology, as seen with the agreement with Sovereign Realty Partners in Q2 2025, shows management views the platform itself as a competitive moat. New entrants must either spend heavily to replicate this integrated tech stack or rely on third-party, less-integrated solutions, which puts them at an immediate productivity disadvantage.
Fathom Holdings Inc.'s achieved scale creates a substantial barrier that new entrants will struggle to match quickly. As of September 30, 2025, Fathom Holdings Inc.'s network stood at approximately 15,371 agent licenses, representing a year-over-year growth of 24.1%. New competitors face the difficult task of recruiting and retaining that many agents in a competitive environment, especially when established players offer proven support systems.
The validation of the scalable, lower-overhead model is evident in the financial results. Achieving positive Adjusted EBITDA, as seen with $6,000 in Q3 2025, proves that once a certain scale is reached, the fixed-cost structure of the cloud-based operation can generate profit. This profitability, even if modest, signals to potential entrants that the model works, but also shows the high hurdle of reaching that inflection point.
Here's a quick look at the operational scale and financial validation points as of the end of Q3 2025:
| Metric | Q3 2025 Value | Context/Significance |
| Agent Licenses | 15,371 | Substantial scale barrier to overcome. |
| Adjusted EBITDA | $6,000 | Second consecutive quarter of positive profitability. |
| Total Revenue | $115.3 million | Reflects 37.7% year-over-year growth. |
| Real Estate Transactions | 11,479 | Represents a 23.0% year-over-year increase. |
The threat is further mitigated by the success of agent-centric programs that increase stickiness, which new entrants would need to immediately match:
- The Elevate program is scaling, with over 165 agents onboarded and another 45 in the pipeline as of Q3 2025.
- The company is actively expanding ancillary services, with Verus Title expanding into Arizona and Alabama.
- The brokerage segment's Adjusted EBITDA increased by 100% to $1.6 million for Q3 2025 compared to 2024.
Honestly, while the initial software investment is lower than building a national office chain, the required investment in proprietary tech like intelliAgent and the cost of acquiring agent density make the true barrier to entry quite high for any competitor aiming for Fathom Holdings Inc.'s level of operational efficiency.
Disclaimer
All information, articles, and product details provided on this website are for general informational and educational purposes only. We do not claim any ownership over, nor do we intend to infringe upon, any trademarks, copyrights, logos, brand names, or other intellectual property mentioned or depicted on this site. Such intellectual property remains the property of its respective owners, and any references here are made solely for identification or informational purposes, without implying any affiliation, endorsement, or partnership.
We make no representations or warranties, express or implied, regarding the accuracy, completeness, or suitability of any content or products presented. Nothing on this website should be construed as legal, tax, investment, financial, medical, or other professional advice. In addition, no part of this site—including articles or product references—constitutes a solicitation, recommendation, endorsement, advertisement, or offer to buy or sell any securities, franchises, or other financial instruments, particularly in jurisdictions where such activity would be unlawful.
All content is of a general nature and may not address the specific circumstances of any individual or entity. It is not a substitute for professional advice or services. Any actions you take based on the information provided here are strictly at your own risk. You accept full responsibility for any decisions or outcomes arising from your use of this website and agree to release us from any liability in connection with your use of, or reliance upon, the content or products found herein.