
|
Valoración DCF del Grupo de Fórmula Uno (FWONA) |
Completamente Editable: Adáptelo A Sus Necesidades En Excel O Sheets
Diseño Profesional: Plantillas Confiables Y Estándares De La Industria
Predeterminadas Para Un Uso Rápido Y Eficiente
Compatible con MAC / PC, completamente desbloqueado
No Se Necesita Experiencia; Fáciles De Seguir
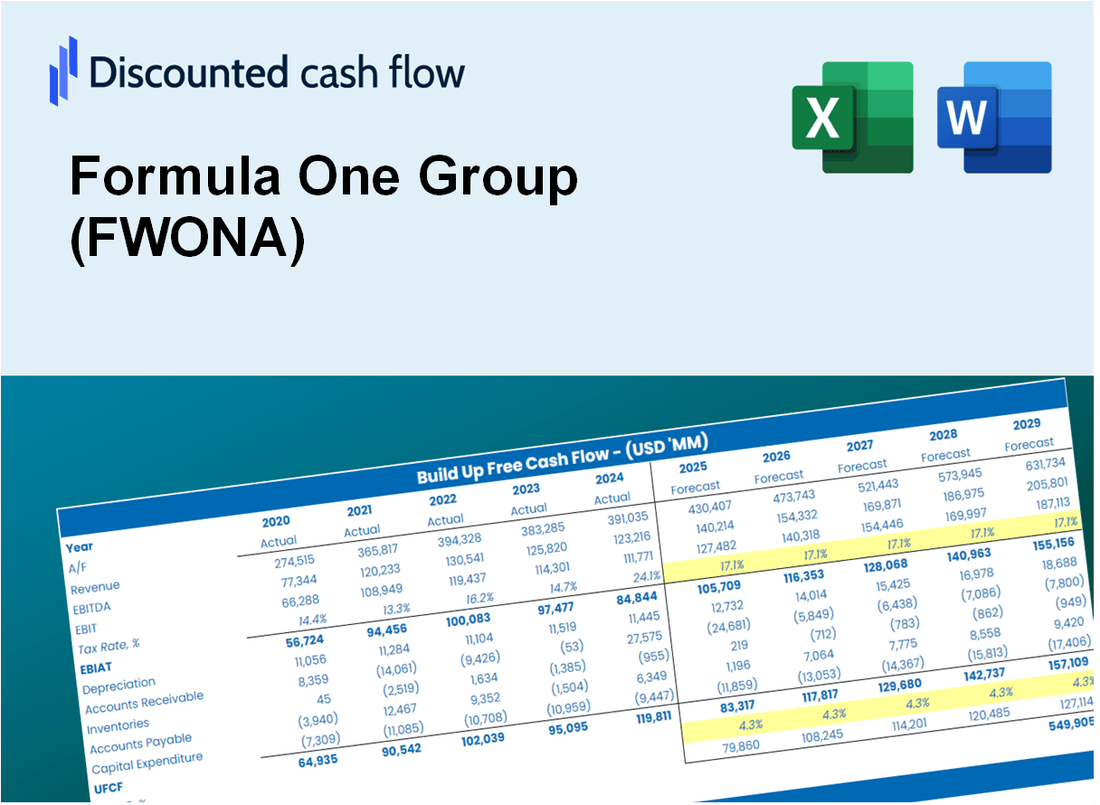
Formula One Group (FWONA) Bundle
¡Descubra el valor real del grupo de Fórmula Uno con nuestra calculadora DCF avanzada! Ajuste los supuestos cruciales, explore varios escenarios y evalúe cómo los cambios afectan la valoración del grupo de Fórmula Uno, todo dentro de una plantilla integral de Excel.
What You Will Receive
- Genuine Formula One Data: Preloaded financials – encompassing revenue to EBIT – based on actual and projected metrics.
- Complete Customization: Modify all essential parameters (yellow cells) such as WACC, growth %, and tax rates.
- Instant Valuation Refreshes: Automatic recalculations to assess the effects of changes on Formula One Group’s fair value.
- Flexible Excel Template: Designed for quick modifications, scenario analysis, and comprehensive projections.
- Efficient and Precise: Avoid building models from the ground up while ensuring accuracy and adaptability.
Key Features
- Customizable Financial Inputs: Adjust essential metrics such as revenue growth, EBITDA %, and capital expenditures tailored to (FWONA).
- Instant DCF Valuation: Quickly computes intrinsic value, NPV, and additional financial outputs for (FWONA).
- High-Precision Results: Leverages Formula One Group's actual financial data for accurate valuation insights.
- Simplified Scenario Testing: Easily explore various assumptions and evaluate their impacts on (FWONA).
- Efficiency Booster: Streamlines the valuation process, removing the need for intricate model development from the ground up.
How It Works
- Step 1: Download the Excel file.
- Step 2: Review pre-entered Formula One Group (FWONA) data (historical and projected).
- Step 3: Adjust key assumptions (yellow cells) based on your analysis.
- Step 4: View automatic recalculations for Formula One Group’s intrinsic value.
- Step 5: Use the outputs for investment decisions or reporting.
Why Choose Formula One Group (FWONA)?
- Save Time: Quickly access essential data without the hassle of extensive research.
- Enhance Accuracy: Utilize verified statistics and methodologies to minimize valuation errors.
- Fully Customizable: Adjust the parameters to align with your specific forecasts and insights.
- Easy to Analyze: Intuitive visuals and outputs simplify the interpretation of results.
- Endorsed by Professionals: Built for industry experts who prioritize accuracy and functionality.
Who Should Use This Product?
- Investors: Accurately assess the fair value of Formula One Group (FWONA) prior to making investment decisions.
- CFOs: Utilize a professional-grade DCF model for financial reporting and analysis specific to the motorsports industry.
- Consultants: Easily modify the template for valuation reports tailored to clients in the sports sector.
- Entrepreneurs: Discover insights into financial modeling practices employed by leading companies in the entertainment and sports fields.
- Educators: Employ it as a teaching resource to illustrate valuation methodologies relevant to the sports and entertainment industries.
What the Template Contains
- Historical Data: Includes Formula One Group’s past financials and baseline forecasts.
- DCF and Levered DCF Models: Detailed templates to calculate Formula One Group’s intrinsic value.
- WACC Sheet: Pre-built calculations for Weighted Average Cost of Capital.
- Editable Inputs: Modify key drivers like growth rates, EBITDA %, and CAPEX assumptions.
- Quarterly and Annual Statements: A complete breakdown of Formula One Group’s financials.
- Interactive Dashboard: Visualize valuation results and projections dynamically.
Disclaimer
All information, articles, and product details provided on this website are for general informational and educational purposes only. We do not claim any ownership over, nor do we intend to infringe upon, any trademarks, copyrights, logos, brand names, or other intellectual property mentioned or depicted on this site. Such intellectual property remains the property of its respective owners, and any references here are made solely for identification or informational purposes, without implying any affiliation, endorsement, or partnership.
We make no representations or warranties, express or implied, regarding the accuracy, completeness, or suitability of any content or products presented. Nothing on this website should be construed as legal, tax, investment, financial, medical, or other professional advice. In addition, no part of this site—including articles or product references—constitutes a solicitation, recommendation, endorsement, advertisement, or offer to buy or sell any securities, franchises, or other financial instruments, particularly in jurisdictions where such activity would be unlawful.
All content is of a general nature and may not address the specific circumstances of any individual or entity. It is not a substitute for professional advice or services. Any actions you take based on the information provided here are strictly at your own risk. You accept full responsibility for any decisions or outcomes arising from your use of this website and agree to release us from any liability in connection with your use of, or reliance upon, the content or products found herein.