
|
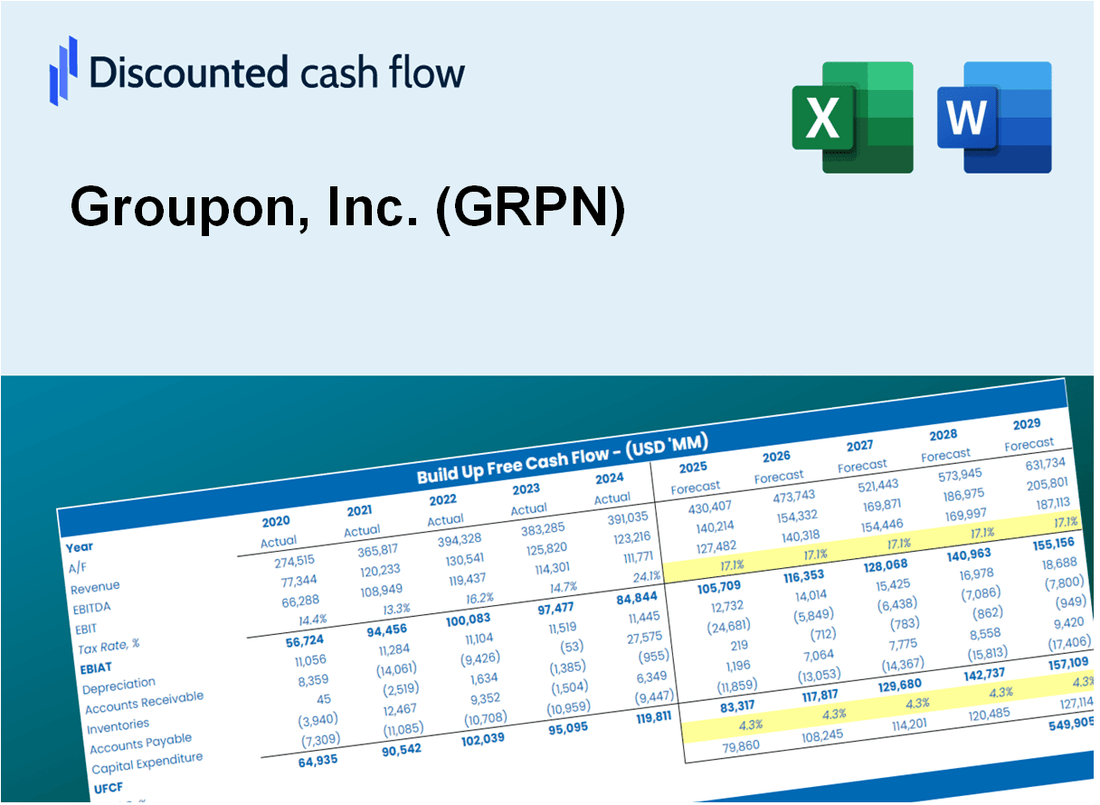
Valoración DCF de Groupon, Inc. (GRPN) |
Completamente Editable: Adáptelo A Sus Necesidades En Excel O Sheets
Diseño Profesional: Plantillas Confiables Y Estándares De La Industria
Predeterminadas Para Un Uso Rápido Y Eficiente
Compatible con MAC / PC, completamente desbloqueado
No Se Necesita Experiencia; Fáciles De Seguir
Groupon, Inc. (GRPN) Bundle
Diseñada para la precisión, nuestra calculadora DCF (GRPN) le permite evaluar la valoración de Groupon, Inc. utilizando datos financieros reales al tiempo que ofrece flexibilidad completa para modificar todos los parámetros clave para las proyecciones mejoradas.
Discounted Cash Flow (DCF) - (USD MM)
| Year | AY1 2020 |
AY2 2021 |
AY3 2022 |
AY4 2023 |
AY5 2024 |
FY1 2025 |
FY2 2026 |
FY3 2027 |
FY4 2028 |
FY5 2029 |
|---|---|---|---|---|---|---|---|---|---|---|
| Revenue | 1,416.9 | 967.1 | 599.1 | 514.9 | 492.6 | 384.0 | 299.3 | 233.3 | 181.9 | 141.8 |
| Revenue Growth, % | 0 | -31.74 | -38.05 | -14.05 | -4.34 | -22.05 | -22.05 | -22.05 | -22.05 | -22.05 |
| EBITDA | -173.4 | 178.1 | -114.9 | 23.5 | 9.0 | -5.1 | -4.0 | -3.1 | -2.4 | -1.9 |
| EBITDA, % | -12.23 | 18.41 | -19.18 | 4.57 | 1.84 | -1.32 | -1.32 | -1.32 | -1.32 | -1.32 |
| Depreciation | 87.5 | 72.8 | 62.7 | 51.2 | 30.9 | 31.0 | 24.2 | 18.8 | 14.7 | 11.5 |
| Depreciation, % | 6.18 | 7.53 | 10.46 | 9.95 | 6.27 | 8.08 | 8.08 | 8.08 | 8.08 | 8.08 |
| EBIT | -260.9 | 105.2 | -177.6 | -27.7 | -21.9 | -36.1 | -28.1 | -21.9 | -17.1 | -13.3 |
| EBIT, % | -18.41 | 10.88 | -29.64 | -5.38 | -4.44 | -9.4 | -9.4 | -9.4 | -9.4 | -9.4 |
| Total Cash | 850.6 | 498.7 | 281.3 | 141.6 | 228.8 | 178.5 | 139.2 | 108.5 | 84.6 | 65.9 |
| Total Cash, percent | .0 | .0 | .0 | .0 | .0 | .0 | .0 | .0 | .0 | .0 |
| Account Receivables | 48.4 | 44.5 | 51.7 | 55.7 | 36.8 | 26.8 | 20.9 | 16.3 | 12.7 | 9.9 |
| Account Receivables, % | 3.42 | 4.6 | 8.62 | 10.82 | 7.48 | 6.99 | 6.99 | 6.99 | 6.99 | 6.99 |
| Inventories | 1.3 | .0 | .0 | .0 | .0 | .1 | .1 | .0 | .0 | .0 |
| Inventories, % | 0.0903401 | 0 | 0 | 0 | 0 | 0.01806802 | 0.01806802 | 0.01806802 | 0.01806802 | 0.01806802 |
| Accounts Payable | 33.0 | 22.2 | 59.6 | 15.0 | 11.3 | 15.2 | 11.8 | 9.2 | 7.2 | 5.6 |
| Accounts Payable, % | 2.33 | 2.29 | 9.94 | 2.92 | 2.3 | 3.96 | 3.96 | 3.96 | 3.96 | 3.96 |
| Capital Expenditure | -53.0 | -52.8 | -38.8 | -19.3 | -15.9 | -17.4 | -13.6 | -10.6 | -8.2 | -6.4 |
| Capital Expenditure, % | -3.74 | -5.46 | -6.48 | -3.75 | -3.23 | -4.53 | -4.53 | -4.53 | -4.53 | -4.53 |
| Tax Rate, % | -94.23 | -94.23 | -94.23 | -94.23 | -94.23 | -94.23 | -94.23 | -94.23 | -94.23 | -94.23 |
| EBITAT | -255.4 | 141.9 | -219.8 | -35.4 | -42.5 | -35.9 | -28.0 | -21.8 | -17.0 | -13.3 |
| Depreciation | ||||||||||
| Changes in Account Receivables | ||||||||||
| Changes in Inventories | ||||||||||
| Changes in Accounts Payable | ||||||||||
| Capital Expenditure | ||||||||||
| UFCF | -237.5 | 156.3 | -165.8 | -52.0 | -12.3 | -8.5 | -14.8 | -11.6 | -9.0 | -7.0 |
| WACC, % | 4.42 | 4.44 | 4.44 | 4.44 | 4.44 | 4.44 | 4.44 | 4.44 | 4.44 | 4.44 |
| PV UFCF | ||||||||||
| SUM PV UFCF | -45.1 | |||||||||
| Long Term Growth Rate, % | 2.00 | |||||||||
| Free cash flow (T + 1) | -7 | |||||||||
| Terminal Value | -294 | |||||||||
| Present Terminal Value | -237 | |||||||||
| Enterprise Value | -282 | |||||||||
| Net Debt | 24 | |||||||||
| Equity Value | -306 | |||||||||
| Diluted Shares Outstanding, MM | 39 | |||||||||
| Equity Value Per Share | -7.81 |
What You Will Get
- Real GRPN Financials: Access to historical and projected data for precise valuation.
- Customizable Inputs: Adjust WACC, tax rates, revenue growth, and capital expenditures as needed.
- Dynamic Calculations: Intrinsic value and NPV are computed in real-time.
- Scenario Analysis: Evaluate various scenarios to assess Groupon’s future performance.
- User-Friendly Design: Tailored for professionals while remaining approachable for newcomers.
Key Features
- Customizable Revenue Assumptions: Adjust essential factors such as discount rates, user growth, and marketing spend.
- Instant DCF Valuation: Quickly computes intrinsic value, NPV, and other financial metrics.
- High-Precision Accuracy: Leverages Groupon’s actual financial data for credible valuation results.
- Effortless Scenario Testing: Explore various scenarios and analyze results with ease.
- Efficiency Booster: Streamlines the valuation process, removing the need for intricate model construction.
How It Works
- 1. Access the Template: Download and open the Excel file containing Groupon, Inc. (GRPN)'s preloaded data.
- 2. Modify Assumptions: Adjust key inputs such as growth rates, WACC, and capital expenditures.
- 3. View Results Instantly: The DCF model automatically computes intrinsic value and NPV.
- 4. Explore Scenarios: Evaluate multiple forecasts to assess various valuation outcomes.
- 5. Present with Assurance: Deliver professional valuation insights to enhance your decision-making process.
Why Choose This Groupon Calculator?
- Accuracy: Real Groupon financials ensure data accuracy.
- Flexibility: Tailored for users to experiment and adjust inputs effortlessly.
- Time-Saving: Avoid the complexities of creating a DCF model from the ground up.
- Professional-Grade: Crafted with CFO-level precision and ease of use in mind.
- User-Friendly: Simple to navigate, even for those without extensive financial modeling knowledge.
Who Should Use This Product?
- Professional Investors: Develop comprehensive valuation models for analyzing Groupon's market performance.
- Corporate Finance Teams: Evaluate valuation scenarios to inform strategic decision-making for Groupon, Inc. (GRPN).
- Consultants and Advisors: Deliver precise valuation insights to clients interested in Groupon's stock.
- Students and Educators: Utilize real-world data to enhance learning and practice in financial modeling with Groupon, Inc. (GRPN).
- Tech Enthusiasts: Gain insights into how companies like Groupon are valued within the tech sector.
What the Template Contains
- Operating and Balance Sheet Data: Pre-filled Groupon historical data and forecasts, including revenue, EBITDA, EBIT, and capital expenditures.
- WACC Calculation: A dedicated sheet for Weighted Average Cost of Capital (WACC), featuring parameters such as Beta, risk-free rate, and share price.
- DCF Valuation (Unlevered and Levered): Editable Discounted Cash Flow models displaying intrinsic value with comprehensive calculations.
- Financial Statements: Pre-loaded financial statements (annual and quarterly) to facilitate analysis.
- Key Ratios: Includes profitability, leverage, and efficiency ratios for Groupon, Inc. (GRPN).
- Dashboard and Charts: Visual summary of valuation outputs and assumptions for easy result analysis.
Disclaimer
All information, articles, and product details provided on this website are for general informational and educational purposes only. We do not claim any ownership over, nor do we intend to infringe upon, any trademarks, copyrights, logos, brand names, or other intellectual property mentioned or depicted on this site. Such intellectual property remains the property of its respective owners, and any references here are made solely for identification or informational purposes, without implying any affiliation, endorsement, or partnership.
We make no representations or warranties, express or implied, regarding the accuracy, completeness, or suitability of any content or products presented. Nothing on this website should be construed as legal, tax, investment, financial, medical, or other professional advice. In addition, no part of this site—including articles or product references—constitutes a solicitation, recommendation, endorsement, advertisement, or offer to buy or sell any securities, franchises, or other financial instruments, particularly in jurisdictions where such activity would be unlawful.
All content is of a general nature and may not address the specific circumstances of any individual or entity. It is not a substitute for professional advice or services. Any actions you take based on the information provided here are strictly at your own risk. You accept full responsibility for any decisions or outcomes arising from your use of this website and agree to release us from any liability in connection with your use of, or reliance upon, the content or products found herein.