
|
Heineken Holding N.V. (Heio.as) Valoración de DCF |
Completamente Editable: Adáptelo A Sus Necesidades En Excel O Sheets
Diseño Profesional: Plantillas Confiables Y Estándares De La Industria
Predeterminadas Para Un Uso Rápido Y Eficiente
Compatible con MAC / PC, completamente desbloqueado
No Se Necesita Experiencia; Fáciles De Seguir
Heineken Holding N.V. (HEIO.AS) Bundle
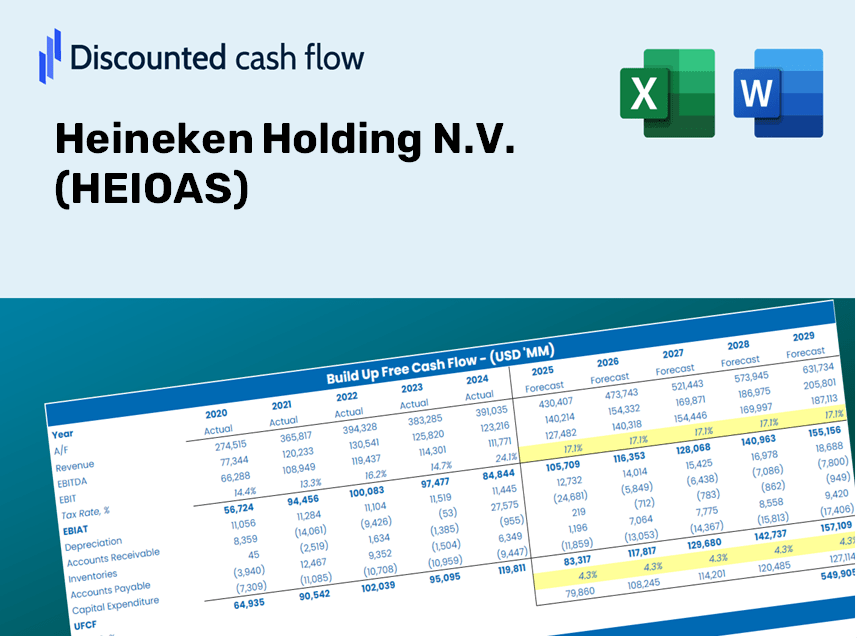
¡Simplifique la valoración de Heineken Holding N.V. con esta calculadora DCF personalizable! Con el verdadero Heineken Holding N.V. Financials y las entradas de pronóstico ajustables, puede probar escenarios y descubrir el valor razonable de Heineken Holding N.V. en minutos.
Discounted Cash Flow (DCF) - (USD MM)
| Year | AY1 2020 |
AY2 2021 |
AY3 2022 |
AY4 2023 |
AY5 2024 |
FY1 2025 |
FY2 2026 |
FY3 2027 |
FY4 2028 |
FY5 2029 |
|---|---|---|---|---|---|---|---|---|---|---|
| Revenue | 19,715.0 | 21,941.0 | 28,719.0 | 30,362.0 | 29,821.0 | 30,002.6 | 30,185.3 | 30,369.1 | 30,554.0 | 30,740.1 |
| Revenue Growth, % | 0 | 11.29 | 30.89 | 5.72 | -1.78 | 0.60894 | 0.60894 | 0.60894 | 0.60894 | 0.60894 |
| EBITDA | 2,558.0 | 6,376.0 | 6,670.0 | 5,820.0 | 5,292.0 | 6,131.0 | 6,168.3 | 6,205.9 | 6,243.7 | 6,281.7 |
| EBITDA, % | 12.97 | 29.06 | 23.23 | 19.17 | 17.75 | 20.43 | 20.43 | 20.43 | 20.43 | 20.43 |
| Depreciation | 1,873.0 | 1,840.0 | 2,013.0 | 2,876.0 | 2,605.0 | 2,586.4 | 2,602.2 | 2,618.0 | 2,634.0 | 2,650.0 |
| Depreciation, % | 9.5 | 8.39 | 7.01 | 9.47 | 8.74 | 8.62 | 8.62 | 8.62 | 8.62 | 8.62 |
| EBIT | 685.0 | 4,536.0 | 4,657.0 | 2,944.0 | 2,687.0 | 3,544.5 | 3,566.1 | 3,587.8 | 3,609.7 | 3,631.7 |
| EBIT, % | 3.47 | 20.67 | 16.22 | 9.7 | 9.01 | 11.81 | 11.81 | 11.81 | 11.81 | 11.81 |
| Total Cash | 4,000.0 | 3,248.0 | 2,765.0 | 2,377.0 | 2,350.0 | 3,626.1 | 3,648.2 | 3,670.4 | 3,692.7 | 3,715.2 |
| Total Cash, percent | .0 | .0 | .0 | .0 | .0 | .0 | .0 | .0 | .0 | .0 |
| Account Receivables | 2,578.0 | 3,351.0 | 4,130.0 | 3,376.0 | 4,191.0 | 4,074.5 | 4,099.3 | 4,124.3 | 4,149.4 | 4,174.7 |
| Account Receivables, % | 13.08 | 15.27 | 14.38 | 11.12 | 14.05 | 13.58 | 13.58 | 13.58 | 13.58 | 13.58 |
| Inventories | 1,958.0 | 2,438.0 | 3,250.0 | 3,721.0 | 3,572.0 | 3,395.9 | 3,416.6 | 3,437.4 | 3,458.3 | 3,479.4 |
| Inventories, % | 9.93 | 11.11 | 11.32 | 12.26 | 11.98 | 11.32 | 11.32 | 11.32 | 11.32 | 11.32 |
| Accounts Payable | 3,663.0 | 4,631.0 | 5,852.0 | 5,735.0 | 5,986.0 | 5,942.0 | 5,978.2 | 6,014.6 | 6,051.2 | 6,088.1 |
| Accounts Payable, % | 18.58 | 21.11 | 20.38 | 18.89 | 20.07 | 19.8 | 19.8 | 19.8 | 19.8 | 19.8 |
| Capital Expenditure | -1,640.0 | -1,597.0 | -2,011.0 | -2,677.0 | -2,465.0 | -2,381.2 | -2,395.7 | -2,410.2 | -2,424.9 | -2,439.7 |
| Capital Expenditure, % | -8.32 | -7.28 | -7 | -8.82 | -8.27 | -7.94 | -7.94 | -7.94 | -7.94 | -7.94 |
| Tax Rate, % | 75.19 | 75.19 | 75.19 | 75.19 | 75.19 | 75.19 | 75.19 | 75.19 | 75.19 | 75.19 |
| EBITAT | -383.9 | 3,699.8 | 3,393.9 | 1,370.4 | 666.7 | 1,600.8 | 1,610.5 | 1,620.3 | 1,630.2 | 1,640.1 |
| Depreciation | ||||||||||
| Changes in Account Receivables | ||||||||||
| Changes in Inventories | ||||||||||
| Changes in Accounts Payable | ||||||||||
| Capital Expenditure | ||||||||||
| UFCF | -1,023.9 | 3,657.8 | 3,025.9 | 1,735.4 | 391.7 | 2,054.6 | 1,807.7 | 1,818.7 | 1,829.8 | 1,841.0 |
| WACC, % | 3.07 | 4.68 | 4.51 | 3.99 | 3.56 | 3.96 | 3.96 | 3.96 | 3.96 | 3.96 |
| PV UFCF | ||||||||||
| SUM PV UFCF | 8,350.3 | |||||||||
| Long Term Growth Rate, % | 0.50 | |||||||||
| Free cash flow (T + 1) | 1,850 | |||||||||
| Terminal Value | 53,470 | |||||||||
| Present Terminal Value | 44,033 | |||||||||
| Enterprise Value | 52,383 | |||||||||
| Net Debt | 15,013 | |||||||||
| Equity Value | 37,370 | |||||||||
| Diluted Shares Outstanding, MM | 283 | |||||||||
| Equity Value Per Share | 132.11 |
What You Will Receive
- Genuine Heineken Data: Preloaded financials – covering everything from revenue to EBIT – based on real and projected metrics.
- Complete Customization: Modify all essential parameters (yellow cells) such as WACC, growth %, and tax rates.
- Instant Valuation Updates: Automatic recalculations to evaluate the effect of changes on Heineken's fair value.
- Adaptable Excel Template: Designed for quick modifications, scenario analysis, and thorough projections.
- Efficient and Precise: Eliminate the need to build models from scratch while ensuring accuracy and adaptability.
Key Features
- Customizable Forecast Inputs: Adjust essential parameters such as sales growth, EBITDA %, and capital investments.
- Instant DCF Valuation: Quickly computes intrinsic value, NPV, and various financial metrics.
- High Precision Outputs: Leverages Heineken's actual financial data for accurate valuation results.
- Streamlined Scenario Analysis: Easily explore different scenarios and evaluate their impacts.
- Efficient Valuation Tool: Avoid the complexities of creating detailed valuation models from the ground up.
How It Functions
- Download the Template: Gain immediate access to the Excel-based Heineken DCF Calculator.
- Input Your Assumptions: Modify the yellow-highlighted cells for growth rates, WACC, margins, and other variables.
- Instant Calculations: The model automatically recalculates Heineken’s intrinsic value.
- Test Scenarios: Explore various scenarios to see how different assumptions impact valuation.
- Analyze and Decide: Utilize the outcomes to inform your investment or financial assessment.
Why Choose This Calculator for Heineken Holding N.V. (HEIOAS)?
- Precise Financial Insights: Utilize real Heineken financial data for dependable valuation outcomes.
- Tailorable Features: Modify essential parameters such as growth rates, WACC, and tax rates to align with your forecasts.
- Efficient: Pre-configured calculations save you the hassle of starting from the ground up.
- Professional-Quality Tool: Crafted for investors, analysts, and consultants.
- User-Friendly Interface: Designed with an intuitive layout and step-by-step guidance for ease of use by all individuals.
Who Can Benefit from This Product?
- Individual Investors: Make well-informed decisions regarding the purchase or sale of Heineken stock (HEIOAS).
- Financial Analysts: Enhance valuation workflows with ready-to-implement financial models tailored for Heineken (HEIOAS).
- Consultants: Provide clients with swift and precise valuation insights on Heineken (HEIOAS).
- Business Owners: Gain a deeper understanding of how major companies like Heineken (HEIOAS) are valued to inform your business strategies.
- Finance Students: Develop valuation skills using real-world data and case studies focused on Heineken (HEIOAS).
Contents of the Template
- Operating and Balance Sheet Data: Pre-populated historical data and forecasts for Heineken Holding N.V. (HEIOAS), including metrics such as revenue, EBITDA, EBIT, and capital expenditures.
- WACC Calculation: A specific sheet for calculating the Weighted Average Cost of Capital (WACC), featuring parameters like Beta, risk-free rate, and share price.
- DCF Valuation (Unlevered and Levered): Customizable Discounted Cash Flow models that outline intrinsic value alongside comprehensive calculations.
- Financial Statements: Pre-filled financial statements (both annual and quarterly) to facilitate in-depth analysis.
- Key Ratios: Covers profitability, leverage, and efficiency ratios relevant to Heineken Holding N.V. (HEIOAS).
- Dashboard and Charts: A visual overview of valuation results and assumptions for easier analysis of outcomes.
Disclaimer
All information, articles, and product details provided on this website are for general informational and educational purposes only. We do not claim any ownership over, nor do we intend to infringe upon, any trademarks, copyrights, logos, brand names, or other intellectual property mentioned or depicted on this site. Such intellectual property remains the property of its respective owners, and any references here are made solely for identification or informational purposes, without implying any affiliation, endorsement, or partnership.
We make no representations or warranties, express or implied, regarding the accuracy, completeness, or suitability of any content or products presented. Nothing on this website should be construed as legal, tax, investment, financial, medical, or other professional advice. In addition, no part of this site—including articles or product references—constitutes a solicitation, recommendation, endorsement, advertisement, or offer to buy or sell any securities, franchises, or other financial instruments, particularly in jurisdictions where such activity would be unlawful.
All content is of a general nature and may not address the specific circumstances of any individual or entity. It is not a substitute for professional advice or services. Any actions you take based on the information provided here are strictly at your own risk. You accept full responsibility for any decisions or outcomes arising from your use of this website and agree to release us from any liability in connection with your use of, or reliance upon, the content or products found herein.