
|
Valoración DCF de HarborOne Bancorp, Inc. (HONE) |
Completamente Editable: Adáptelo A Sus Necesidades En Excel O Sheets
Diseño Profesional: Plantillas Confiables Y Estándares De La Industria
Predeterminadas Para Un Uso Rápido Y Eficiente
Compatible con MAC / PC, completamente desbloqueado
No Se Necesita Experiencia; Fáciles De Seguir
HarborOne Bancorp, Inc. (HONE) Bundle
¡Explore Harborone Bancorp, Inc. (Hone) Financial Future con nuestra calculadora DCF fácil de usar! Ingrese sus suposiciones para el crecimiento, los márgenes y los costos para calcular Harborone Bancorp, Inc. (HONE) Valor intrínseco y mejorar su estrategia de inversión.
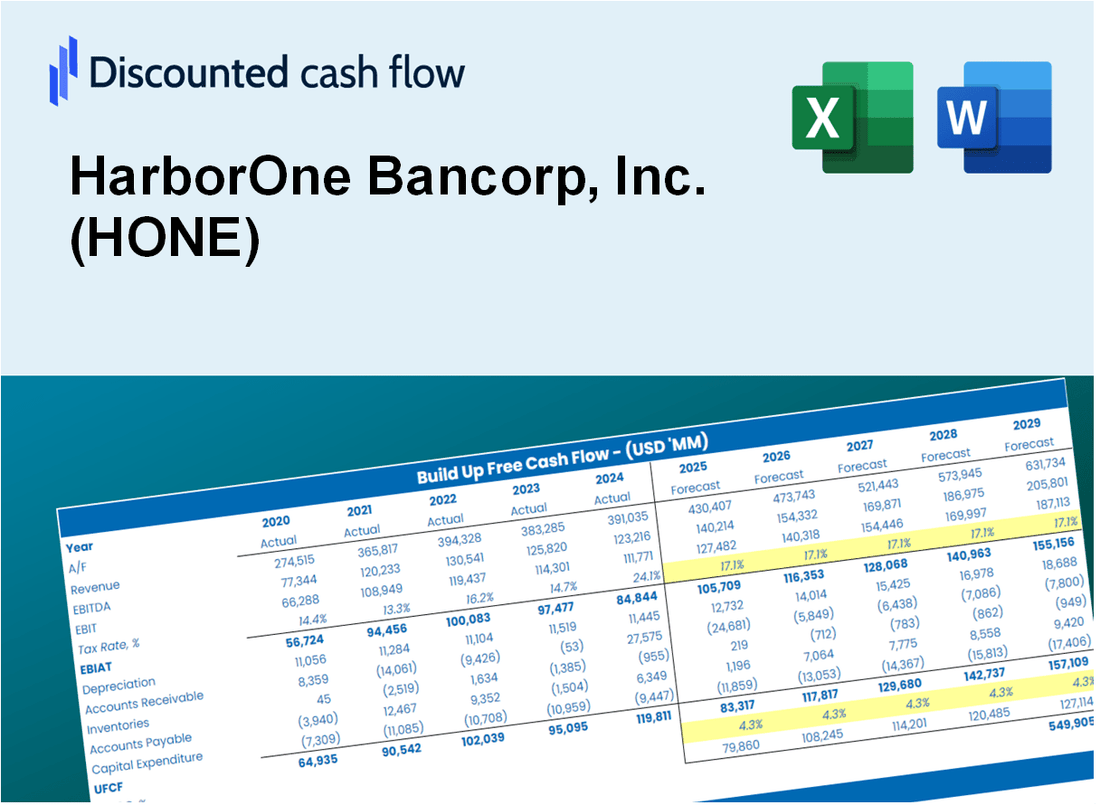
Discounted Cash Flow (DCF) - (USD MM)
| Year | AY1 2020 |
AY2 2021 |
AY3 2022 |
AY4 2023 |
AY5 2024 |
FY1 2025 |
FY2 2026 |
FY3 2027 |
FY4 2028 |
FY5 2029 |
|---|---|---|---|---|---|---|---|---|---|---|
| Revenue | 275.6 | 237.1 | 225.5 | 283.4 | 313.7 | 327.4 | 341.8 | 356.8 | 372.4 | 388.7 |
| Revenue Growth, % | 0 | -13.97 | -4.89 | 25.68 | 10.7 | 4.38 | 4.38 | 4.38 | 4.38 | 4.38 |
| EBITDA | 63.7 | 86.1 | 66.5 | 29.7 | 38.7 | 73.2 | 76.4 | 79.8 | 83.2 | 86.9 |
| EBITDA, % | 23.11 | 36.31 | 29.51 | 10.49 | 12.35 | 22.35 | 22.35 | 22.35 | 22.35 | 22.35 |
| Depreciation | 5.7 | 5.6 | 4.8 | 4.6 | 4.5 | 6.3 | 6.6 | 6.9 | 7.2 | 7.5 |
| Depreciation, % | 2.06 | 2.37 | 2.14 | 1.62 | 1.43 | 1.92 | 1.92 | 1.92 | 1.92 | 1.92 |
| EBIT | 58.0 | 80.5 | 61.7 | 25.1 | 34.3 | 66.9 | 69.8 | 72.9 | 76.1 | 79.4 |
| EBIT, % | 21.05 | 33.94 | 27.38 | 8.87 | 10.92 | 20.43 | 20.43 | 20.43 | 20.43 | 20.43 |
| Total Cash | 482.4 | 588.8 | 399.2 | 517.5 | 495.0 | 327.4 | 341.8 | 356.8 | 372.4 | 388.7 |
| Total Cash, percent | .0 | .0 | .0 | .0 | .0 | .0 | .0 | .0 | .0 | .0 |
| Account Receivables | 11.9 | 10.6 | 15.1 | 18.2 | 18.4 | 18.2 | 19.0 | 19.8 | 20.7 | 21.6 |
| Account Receivables, % | 4.31 | 4.48 | 6.71 | 6.41 | 5.86 | 5.56 | 5.56 | 5.56 | 5.56 | 5.56 |
| Inventories | .0 | .0 | .0 | .0 | .0 | .0 | .0 | .0 | .0 | .0 |
| Inventories, % | 0 | 0 | 0 | 0 | 0 | 0 | 0 | 0 | 0 | 0 |
| Accounts Payable | 1.3 | 1.1 | 2.3 | 5.3 | 6.6 | 3.9 | 4.0 | 4.2 | 4.4 | 4.6 |
| Accounts Payable, % | 0.45799 | 0.45685 | 1.03 | 1.85 | 2.1 | 1.18 | 1.18 | 1.18 | 1.18 | 1.18 |
| Capital Expenditure | -5.7 | -6.5 | -2.3 | -4.5 | -1.2 | -5.1 | -5.3 | -5.6 | -5.8 | -6.1 |
| Capital Expenditure, % | -2.08 | -2.72 | -1 | -1.58 | -0.39465 | -1.56 | -1.56 | -1.56 | -1.56 | -1.56 |
| Tax Rate, % | 20 | 20 | 20 | 20 | 20 | 20 | 20 | 20 | 20 | 20 |
| EBITAT | 44.8 | 58.5 | 45.6 | 16.1 | 27.4 | 49.2 | 51.4 | 53.6 | 56.0 | 58.4 |
| Depreciation | ||||||||||
| Changes in Account Receivables | ||||||||||
| Changes in Inventories | ||||||||||
| Changes in Accounts Payable | ||||||||||
| Capital Expenditure | ||||||||||
| UFCF | 34.1 | 58.7 | 44.9 | 16.1 | 31.8 | 47.9 | 52.0 | 54.3 | 56.6 | 59.1 |
| WACC, % | 14.52 | 13.88 | 14.04 | 12.62 | 14.92 | 13.99 | 13.99 | 13.99 | 13.99 | 13.99 |
| PV UFCF | ||||||||||
| SUM PV UFCF | 182.9 | |||||||||
| Long Term Growth Rate, % | 2.00 | |||||||||
| Free cash flow (T + 1) | 60 | |||||||||
| Terminal Value | 503 | |||||||||
| Present Terminal Value | 261 | |||||||||
| Enterprise Value | 444 | |||||||||
| Net Debt | 285 | |||||||||
| Equity Value | 159 | |||||||||
| Diluted Shares Outstanding, MM | 41 | |||||||||
| Equity Value Per Share | 3.83 |
What You Will Get
- Real HarborOne Data: Preloaded financials – from revenue to EBIT – based on actual and projected figures for HarborOne Bancorp, Inc. (HONE).
- Full Customization: Adjust all critical parameters (yellow cells) like WACC, growth %, and tax rates specifically for HarborOne Bancorp, Inc. (HONE).
- Instant Valuation Updates: Automatic recalculations to analyze the impact of changes on HarborOne Bancorp, Inc.'s (HONE) fair value.
- Versatile Excel Template: Tailored for quick edits, scenario testing, and detailed projections related to HarborOne Bancorp, Inc. (HONE).
- Time-Saving and Accurate: Skip building models from scratch while maintaining precision and flexibility for HarborOne Bancorp, Inc. (HONE).
Key Features
- Customizable Financial Inputs: Adjust essential parameters such as loan growth, net interest margin, and operating expenses.
- Instant DCF Valuation: Quickly computes intrinsic value, NPV, and additional metrics without delay.
- High-Precision Accuracy: Leverages HarborOne Bancorp's (HONE) actual financial data for credible valuation results.
- Simplified Scenario Analysis: Evaluate various assumptions and analyze results effortlessly.
- Efficiency Booster: Streamline the valuation process, removing the need to construct intricate models from the ground up.
How It Works
- Download the Template: Gain immediate access to the Excel-based HONE DCF Calculator.
- Input Your Assumptions: Modify the yellow-highlighted cells for growth rates, WACC, margins, and more.
- Instant Calculations: The model automatically recalculates HarborOne Bancorp’s intrinsic value.
- Test Scenarios: Explore various assumptions to assess potential valuation shifts.
- Analyze and Decide: Utilize the results to inform your investment or financial analysis.
Why Choose This Calculator for HarborOne Bancorp, Inc. (HONE)?
- Accurate Data: Utilize real HarborOne financials for dependable valuation outcomes.
- Customizable: Tailor essential parameters such as growth rates, WACC, and tax rates to align with your forecasts.
- Time-Saving: Built-in calculations save you the hassle of starting from the ground up.
- Professional-Grade Tool: Crafted for investors, analysts, and financial consultants.
- User-Friendly: Easy-to-navigate interface and clear instructions cater to users of all experience levels.
Who Should Use This Product?
- Finance Students: Master financial analysis techniques and apply them to real-world data.
- Academics: Integrate advanced financial models into your teaching or research projects.
- Investors: Validate your investment strategies and evaluate the financial performance of HarborOne Bancorp, Inc. (HONE).
- Analysts: Enhance your analysis process with a ready-to-use, customizable DCF model.
- Small Business Owners: Understand how financial institutions like HarborOne Bancorp, Inc. (HONE) are assessed and valued.
What the Template Contains
- Pre-Filled Data: Includes HarborOne Bancorp, Inc.'s (HONE) historical financials and forecasts.
- Discounted Cash Flow Model: Editable DCF valuation model with automatic calculations.
- Weighted Average Cost of Capital (WACC): A dedicated sheet for calculating WACC based on custom inputs.
- Key Financial Ratios: Analyze HarborOne Bancorp, Inc.'s (HONE) profitability, efficiency, and leverage.
- Customizable Inputs: Edit revenue growth, margins, and tax rates with ease.
- Clear Dashboard: Charts and tables summarizing key valuation results.
Disclaimer
All information, articles, and product details provided on this website are for general informational and educational purposes only. We do not claim any ownership over, nor do we intend to infringe upon, any trademarks, copyrights, logos, brand names, or other intellectual property mentioned or depicted on this site. Such intellectual property remains the property of its respective owners, and any references here are made solely for identification or informational purposes, without implying any affiliation, endorsement, or partnership.
We make no representations or warranties, express or implied, regarding the accuracy, completeness, or suitability of any content or products presented. Nothing on this website should be construed as legal, tax, investment, financial, medical, or other professional advice. In addition, no part of this site—including articles or product references—constitutes a solicitation, recommendation, endorsement, advertisement, or offer to buy or sell any securities, franchises, or other financial instruments, particularly in jurisdictions where such activity would be unlawful.
All content is of a general nature and may not address the specific circumstances of any individual or entity. It is not a substitute for professional advice or services. Any actions you take based on the information provided here are strictly at your own risk. You accept full responsibility for any decisions or outcomes arising from your use of this website and agree to release us from any liability in connection with your use of, or reliance upon, the content or products found herein.