
|
Valoración DCF de HealthEquity, Inc. (HQY) |
Completamente Editable: Adáptelo A Sus Necesidades En Excel O Sheets
Diseño Profesional: Plantillas Confiables Y Estándares De La Industria
Predeterminadas Para Un Uso Rápido Y Eficiente
Compatible con MAC / PC, completamente desbloqueado
No Se Necesita Experiencia; Fáciles De Seguir
HealthEquity, Inc. (HQY) Bundle
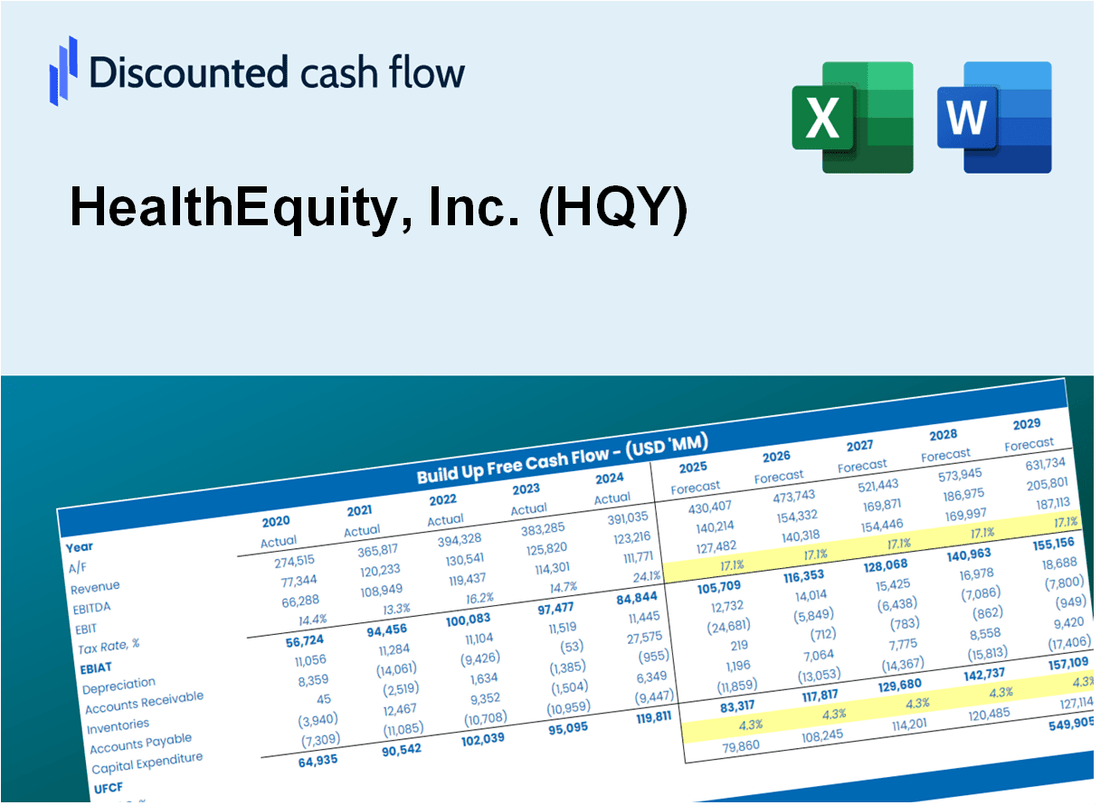
Diseñada para la precisión, nuestra calculadora DCF (HQY) le permite evaluar la valoración de HealthEquity, Inc. utilizando datos financieros del mundo real y proporciona la flexibilidad para modificar todos los parámetros esenciales para mejorar los pronósticos.
Discounted Cash Flow (DCF) - (USD MM)
| Year | AY1 2021 |
AY2 2022 |
AY3 2023 |
AY4 2024 |
AY5 2025 |
FY1 2026 |
FY2 2027 |
FY3 2028 |
FY4 2029 |
FY5 2030 |
|---|---|---|---|---|---|---|---|---|---|---|
| Revenue | 733.6 | 756.6 | 861.7 | 999.6 | 1,199.8 | 1,358.9 | 1,539.2 | 1,743.4 | 1,974.6 | 2,236.5 |
| Revenue Growth, % | 0 | 3.13 | 13.9 | 16 | 20.03 | 13.26 | 13.26 | 13.26 | 13.26 | 13.26 |
| EBITDA | 154.9 | 103.0 | 171.5 | 282.4 | 337.5 | 301.7 | 341.8 | 387.1 | 438.4 | 496.6 |
| EBITDA, % | 21.12 | 13.61 | 19.9 | 28.25 | 28.13 | 22.2 | 22.2 | 22.2 | 22.2 | 22.2 |
| Depreciation | 115.9 | 137.2 | 161.2 | 153.1 | 162.5 | 221.5 | 250.9 | 284.1 | 321.8 | 364.5 |
| Depreciation, % | 15.8 | 18.13 | 18.71 | 15.31 | 13.54 | 16.3 | 16.3 | 16.3 | 16.3 | 16.3 |
| EBIT | 39.0 | -34.2 | 10.3 | 129.3 | 175.1 | 80.3 | 90.9 | 103.0 | 116.6 | 132.1 |
| EBIT, % | 5.32 | -4.52 | 1.2 | 12.94 | 14.59 | 5.91 | 5.91 | 5.91 | 5.91 | 5.91 |
| Total Cash | 328.8 | 225.4 | 254.3 | 404.0 | 295.9 | 459.9 | 520.9 | 590.0 | 668.2 | 756.9 |
| Total Cash, percent | .0 | .0 | .0 | .0 | .0 | .0 | .0 | .0 | .0 | .0 |
| Account Receivables | 72.8 | 87.4 | 96.8 | 104.9 | 118.0 | 144.2 | 163.3 | 184.9 | 209.5 | 237.3 |
| Account Receivables, % | 9.92 | 11.56 | 11.24 | 10.49 | 9.84 | 10.61 | 10.61 | 10.61 | 10.61 | 10.61 |
| Inventories | .0 | .0 | .0 | .0 | .0 | .0 | .0 | .0 | .0 | .0 |
| Inventories, % | 0 | 0 | 0 | 0 | 0 | 0 | 0 | 0 | 0 | 0 |
| Accounts Payable | 1.6 | 27.5 | 13.9 | 12.0 | 14.4 | 21.4 | 24.2 | 27.5 | 31.1 | 35.2 |
| Accounts Payable, % | 0.22002 | 3.64 | 1.61 | 1.2 | 1.2 | 1.57 | 1.57 | 1.57 | 1.57 | 1.57 |
| Capital Expenditure | -97.0 | -137.1 | -119.1 | -46.1 | -2.1 | -135.7 | -153.7 | -174.1 | -197.2 | -223.4 |
| Capital Expenditure, % | -13.22 | -18.12 | -13.82 | -4.61 | -0.1737 | -9.99 | -9.99 | -9.99 | -9.99 | -9.99 |
| Tax Rate, % | 16.66 | 16.66 | 16.66 | 16.66 | 16.66 | 16.66 | 16.66 | 16.66 | 16.66 | 16.66 |
| EBITAT | 83.3 | -22.7 | 7.1 | 96.0 | 145.9 | 63.0 | 71.4 | 80.8 | 91.6 | 103.7 |
| Depreciation | ||||||||||
| Changes in Account Receivables | ||||||||||
| Changes in Inventories | ||||||||||
| Changes in Accounts Payable | ||||||||||
| Capital Expenditure | ||||||||||
| UFCF | 31.1 | -11.3 | 26.1 | 193.1 | 295.5 | 129.6 | 152.2 | 172.4 | 195.3 | 221.2 |
| WACC, % | 4.77 | 4.57 | 4.58 | 4.62 | 4.67 | 4.64 | 4.64 | 4.64 | 4.64 | 4.64 |
| PV UFCF | ||||||||||
| SUM PV UFCF | 752.5 | |||||||||
| Long Term Growth Rate, % | 4.00 | |||||||||
| Free cash flow (T + 1) | 230 | |||||||||
| Terminal Value | 35,857 | |||||||||
| Present Terminal Value | 28,580 | |||||||||
| Enterprise Value | 29,332 | |||||||||
| Net Debt | 813 | |||||||||
| Equity Value | 28,520 | |||||||||
| Diluted Shares Outstanding, MM | 89 | |||||||||
| Equity Value Per Share | 321.07 |
What You Will Get
- Real HealthEquity Data: Preloaded financials – from revenue to EBIT – based on actual and projected figures for HealthEquity, Inc. (HQY).
- Full Customization: Adjust all critical parameters (yellow cells) like WACC, growth %, and tax rates to fit HealthEquity's unique financial landscape.
- Instant Valuation Updates: Automatic recalculations to analyze the impact of changes on HealthEquity, Inc.'s (HQY) fair value.
- Versatile Excel Template: Tailored for quick edits, scenario testing, and detailed projections specific to HealthEquity, Inc. (HQY).
- Time-Saving and Accurate: Skip building models from scratch while maintaining precision and flexibility for HealthEquity, Inc. (HQY).
Key Features
- Comprehensive Health Data: Gain access to reliable historical metrics and future forecasts for HealthEquity, Inc. (HQY).
- Adjustable Financial Assumptions: Modify highlighted cells for key inputs like discount rates, growth expectations, and profit margins.
- Real-Time Analytics: Instant updates to cash flow projections, Discounted Cash Flow (DCF), and Net Present Value (NPV) calculations.
- User-Friendly Dashboard: Intuitive charts and summaries designed to help you interpret your valuation insights effortlessly.
- Suitable for All Skill Levels: A straightforward, accessible format tailored for investors, financial officers, and advisors.
How It Works
- Step 1: Download the Excel file.
- Step 2: Review HealthEquity's pre-filled financial data and forecasts.
- Step 3: Modify critical inputs like revenue growth, WACC, and tax rates (highlighted cells).
- Step 4: Watch the DCF model update instantly as you tweak assumptions.
- Step 5: Analyze the outputs and use the results for investment decisions regarding HealthEquity, Inc. (HQY).
Why Choose This Calculator?
- Accurate Data: Real HealthEquity financials ensure reliable valuation results.
- Customizable: Adjust key parameters like growth rates, WACC, and tax rates to align with your forecasts.
- Time-Saving: Pre-built calculations save you from starting from scratch.
- Professional-Grade Tool: Tailored for investors, analysts, and consultants.
- User-Friendly: Intuitive design and step-by-step guidance make it accessible for all users.
Who Should Use HealthEquity, Inc. (HQY)?
- Healthcare Professionals: Understand the financial implications of health savings accounts and their management.
- Academics: Utilize comprehensive data on health equity for research and teaching purposes.
- Investors: Evaluate investment opportunities and analyze the financial performance of HealthEquity, Inc. (HQY).
- Financial Analysts: Enhance your analysis with industry-specific metrics and insights on health savings accounts.
- Small Business Owners: Discover how health savings accounts can benefit your employees and your bottom line.
What the Template Contains
- Comprehensive DCF Model: Editable template featuring detailed valuation calculations tailored for HealthEquity, Inc. (HQY).
- Real-World Data: HealthEquity’s historical and projected financials preloaded for thorough analysis.
- Customizable Parameters: Modify WACC, growth rates, and tax assumptions to explore various scenarios.
- Financial Statements: Complete annual and quarterly breakdowns for enhanced insights.
- Key Ratios: Integrated analysis for profitability, efficiency, and leverage metrics.
- Dashboard with Visual Outputs: Charts and tables designed for clear, actionable insights.
Disclaimer
All information, articles, and product details provided on this website are for general informational and educational purposes only. We do not claim any ownership over, nor do we intend to infringe upon, any trademarks, copyrights, logos, brand names, or other intellectual property mentioned or depicted on this site. Such intellectual property remains the property of its respective owners, and any references here are made solely for identification or informational purposes, without implying any affiliation, endorsement, or partnership.
We make no representations or warranties, express or implied, regarding the accuracy, completeness, or suitability of any content or products presented. Nothing on this website should be construed as legal, tax, investment, financial, medical, or other professional advice. In addition, no part of this site—including articles or product references—constitutes a solicitation, recommendation, endorsement, advertisement, or offer to buy or sell any securities, franchises, or other financial instruments, particularly in jurisdictions where such activity would be unlawful.
All content is of a general nature and may not address the specific circumstances of any individual or entity. It is not a substitute for professional advice or services. Any actions you take based on the information provided here are strictly at your own risk. You accept full responsibility for any decisions or outcomes arising from your use of this website and agree to release us from any liability in connection with your use of, or reliance upon, the content or products found herein.