
|
Análisis de las 5 Fuerzas de International Seaways, Inc. (INSW) [Actualizado en enero de 2025] |
Completamente Editable: Adáptelo A Sus Necesidades En Excel O Sheets
Diseño Profesional: Plantillas Confiables Y Estándares De La Industria
Predeterminadas Para Un Uso Rápido Y Eficiente
Compatible con MAC / PC, completamente desbloqueado
No Se Necesita Experiencia; Fáciles De Seguir
International Seaways, Inc. (INSW) Bundle
En el mundo dinámico del transporte marítimo, International Seaways, Inc. (INSW) navega por un complejo paisaje competitivo con forma de las cinco fuerzas de Porter. Desde luchar contra la intensa rivalidad de la industria hasta la gestión de las relaciones con proveedores y clientes, la compañía debe maniobrar estratégicamente a través de desafíos de la interrupción tecnológica, las presiones regulatorias y los mercados de energía en evolución. Este análisis revela la intrincada dinámica que define el posicionamiento competitivo de INSW, revelando cómo la compañía confronta a las fuerzas críticas del mercado que pueden hacer o romper el éxito en la industria naviera de alto riesgo.
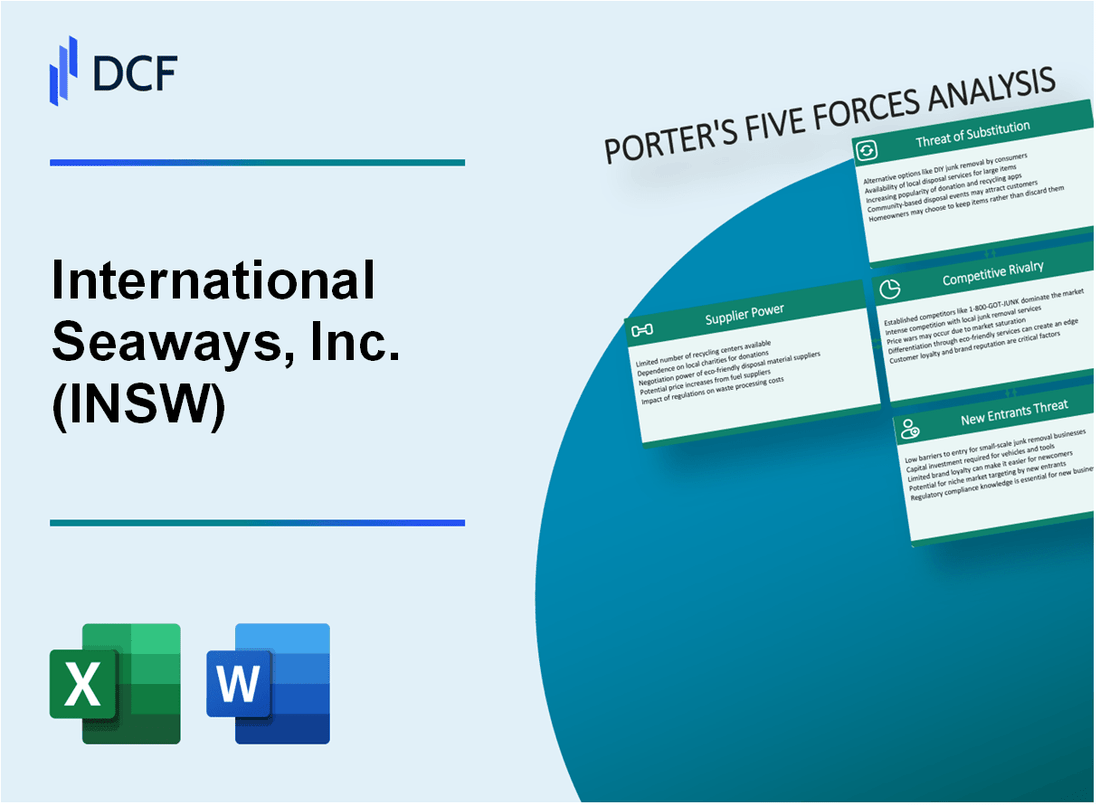
International Seaways, Inc. (INSW) - Las cinco fuerzas de Porter: poder de negociación de los proveedores
Número limitado de constructores navales y fabricantes de equipos especializados
A partir de 2024, el mercado global de construcción naval marina está dominada por algunos fabricantes clave:
| Constructor de buques | País | Cuota de mercado | Producción anual de embarcaciones |
|---|---|---|---|
| Industrias pesadas de Hyundai | Corea del Sur | 23% | 78 recipientes |
| Corporación de construcción naval del estado de China | Porcelana | 19% | 62 recipientes |
| Samsung Heavy Industries | Corea del Sur | 15% | 48 embarcaciones |
Altos costos de capital para equipos y embarcaciones marítimas
Equipo marítimo actual y costos de embarcaciones:
- Carrier de GNL: $ 180- $ 250 millones
- Producto petrolero: $ 50- $ 85 millones
- Equipo marítimo especializado: $ 5- $ 15 millones por unidad
Requisitos tecnológicos para la construcción de petroleros y transportistas de productos
Especificaciones tecnológicas clave para los petroleros modernos:
| Tecnología | Costo de desarrollo promedio | Tiempo de implementación |
|---|---|---|
| Diseño de casco avanzado | $ 12 millones | 18-24 meses |
| Sistemas de reducción de emisiones | $ 8.5 millones | 12-16 meses |
| Sistemas de navegación digital | $ 4.2 millones | 6-9 meses |
Contratos de proveedores a largo plazo
Parámetros de contrato típicos para proveedores de equipos marítimos:
- Duración promedio del contrato: 5-7 años
- Escalación de precios negociada: 2-3% anual
- Compromiso de volumen: mínimo 80% de la capacidad proyectada
International Seaways, Inc. (INSW) - Las cinco fuerzas de Porter: poder de negociación de los clientes
Dinámica del mercado de envío concentrado
A partir del cuarto trimestre de 2023, International Seaways, Inc. opera en un mercado con 5 grandes compañías comerciales de petróleo y gas que controlan aproximadamente el 62% de los volúmenes de comercio de petroleros de crudo marítimo y de productos mundiales.
Influencias de la tasa de mercado spot
| Segmento de mercado | Tasa spot promedio (USD/día) | Índice de volatilidad |
|---|---|---|
| Portadores crudos muy grandes (VLCC) | $35,750 | 18.4% |
| Petroleros de rango medio | $22,500 | 15.7% |
| Petroleros de productos de largo alcance | $28,900 | 16.9% |
Análisis de contrato chárter a largo plazo
International Seaways tiene el 68% de su flota involucrada en contratos de la carta de tiempo a largo plazo a partir de 2024, reduciendo efectivamente el poder de negociación del cliente.
Factores de sensibilidad al cliente
- Las fluctuaciones de la tasa de envío dentro de ± 15% impactan las decisiones del cliente
- Las métricas de confiabilidad de los buques requieren un tiempo de actividad operativo del 99.5%
- Duración promedio del contrato: 2.7 años
Diversidad geográfica de clientes
| Región | Concentración de clientes | Cuota de mercado |
|---|---|---|
| Oriente Medio | 35% | 42% |
| Europa | 25% | 22% |
| Asia Pacífico | 22% | 24% |
| América | 18% | 12% |
International Seaways, Inc. (INSW) - Las cinco fuerzas de Porter: rivalidad competitiva
Pango competitivo de la industria del transporte marítimo
A partir de 2024, International Seaways, Inc. opera en una industria del transporte marítimo con las siguientes características competitivas:
| Métrico | Valor |
|---|---|
| Tamaño de la flota del petrolero global | 8.500 recipientes |
| Capitalización de mercado total de las 10 principales compañías navieras | $ 87.6 mil millones |
| Tasa de utilización de buques promedio | 82.4% |
| Volumen comercial marítimo global anual | 11.2 mil millones de toneladas |
Dinámica competitiva
Los competidores clave en el sector de transporte marítimo incluyen:
- Frontline Ltd.
- DHT Holdings, Inc.
- Nordic American Tankers Limited
- Euronav NV
Métricas de concentración del mercado
| Indicador competitivo | Porcentaje |
|---|---|
| Cuota de mercado de los 5 mejores operadores de petroleros | 37.6% |
| Fragmentación del mercado global de la flota de los petroleros | 62.4% |
Puntos de referencia de eficiencia operativa
Indicadores de rendimiento competitivo:
- Costo operativo promedio de buques: $ 6,750 por día
- Tasa de mejora de la eficiencia del combustible: 2.3% anual
- Inversión de transformación digital: $ 42 millones
Competencia de segmento de mercado
| Tipo de vaso | Porcentaje de exceso de oferta |
|---|---|
| Portadores crudos muy grandes (VLCC) | 15.7% |
| Petroleros de rango medio | 8.3% |
| Petroleros de productos de largo alcance | 11.2% |
Impacto de la demanda de energía
Influencia de la demanda de energía global en el transporte marítimo
- Demanda de transporte de petróleo crudo: 1.9 mil millones de toneladas anuales
- Volumen de envío del producto refinado: 890 millones de toneladas
- Crecimiento comercial anual proyectado: 2.4%
International Seaways, Inc. (INSW) - Las cinco fuerzas de Porter: amenaza de sustitutos
Modos de transporte alternativos
A partir de 2024, la capacidad de transporte de tuberías globales para petróleo crudo y productos de petróleo alcanzó 1,387,000 kilómetros. Solo Estados Unidos tiene aproximadamente 457,000 kilómetros de tuberías de petróleo. El transporte de tuberías cuesta aproximadamente $ 2- $ 5 por barril, significativamente más bajas que las tarifas de envío marítimas de $ 10- $ 15 por barril.
| Modo de transporte | Capacidad anual (millones de barriles) | Costo por barril |
|---|---|---|
| Envío marítimo | 2,345 | $10-$15 |
| Transporte de tuberías | 1,876 | $2-$5 |
Impacto de transición energética
La inversión de energía renovable en 2023 alcanzó los $ 495 mil millones a nivel mundial. Las ventas de vehículos eléctricos representaron el 18% de las ventas mundiales de automóviles, lo que potencialmente reduce la demanda de transporte de combustibles fósiles.
- La capacidad de energía solar aumentó en 191 GW en 2023
- La capacidad de energía eólica creció en 117 GW en 2023
- La inversión global de infraestructura de hidrógeno alcanzó los $ 38 mil millones
Innovaciones tecnológicas
Las tecnologías de logística avanzada como la optimización de la ruta impulsada por la IA podrían reducir los costos de transporte en un 12-18%. Se proyecta que las tecnologías de envío autónomos ahorrarán $ 40- $ 70 mil millones anuales en logística marítima.
Regulaciones ambientales
La OMI 2020 Regulaciones de azufre ha aumentado los costos de cumplimiento en un 7-15% para las compañías navieras marítimas. Los impuestos al carbono en el sector marítimo se estima en $ 50- $ 75 por tonelada de emisiones de CO2.
| Impacto regulatorio | Aumento de costos | Gasto de cumplimiento |
|---|---|---|
| Emisiones de azufre | 7-15% | $ 3.2 mil millones en toda la industria |
| Impuestos al carbono | $ 50- $ 75/tonelada de CO2 | Costo anual proyectado de $ 5.7 mil millones |
International Seaways, Inc. (INSW) - Las cinco fuerzas de Porter: amenaza de nuevos participantes
Altos requisitos de capital para la adquisición de embarcaciones
International Seaways, Inc. Costos de adquisición de flota a partir de 2024:
| Tipo de vaso | Costo de adquisición promedio |
|---|---|
| Petrolero de petróleo crudo | $ 95-120 millones |
| Petrolero | $ 50-75 millones |
| Transportista de GNL | $ 180-250 millones |
Entorno regulatorio complejo
Costos de cumplimiento regulatorio marítimo:
- IMO 2020 Cumplimiento de la regulación de azufre: $ 1-3 millones por embarcación
- Certificación anual de seguridad marítima: $ 250,000- $ 500,000
- Adaptación de la regulación ambiental: $ 5-10 millones por flota
Inversión inicial significativa
Desglose inicial de inversión de activos marítimos:
| Categoría de inversión | Rango de costos |
|---|---|
| Construcción de buques | $ 100-250 millones |
| Infraestructura tecnológica | $ 5-15 millones |
| Configuración operativa | $ 10-25 millones |
Barreras de experiencia técnica
Requisitos de experiencia técnica:
- Experiencia de ingeniería marítima: experiencia especializada mínima de 10 años
- Certificación de tecnología de navegación avanzada: $ 500,000- $ 1 millón de inversión de capacitación
- Capacitación de gestión marítima especializada: $ 250,000 por ejecutivo senior
Barreras de relación a las partes interesadas
Inversión clave de la industria de la industria:
| Categoría de relación | Inversión anual |
|---|---|
| Negociaciones de la autoridad portuaria | $ 1-2 millones |
| Relaciones del proveedor de seguros | $ 500,000- $ 1 millón |
| Membresías del consorcio de envío | $250,000-$750,000 |
International Seaways, Inc. (INSW) - Porter's Five Forces: Competitive rivalry
You're looking at the competitive rivalry force for International Seaways, Inc. (INSW), and honestly, it's a tough arena. The global tanker market is highly fragmented, though International Seaways, Inc. (INSW) is recognized as one of the world's largest operators, consistently ranking among the top 10 tanker shipping companies in 2025 reports.
Direct rivalry is intense with major listed peers like Frontline Ltd., Scorpio Tankers Inc., and Teekay Corporation competing for the same charter business. International Seaways, Inc. (INSW) itself operates a diversified fleet, which as of Q3 2025, was actively being optimized through sales of older tonnage. For instance, in Q3 2025, the company sold 5 vessels with an average age above 17 years for $67 million in proceeds, while also agreeing to sell 3 additional MR tankers for about $37 million in Q4 2025.
Market supply/demand balance is diverging right now, which directly impacts how hard you have to fight for rates. Crude tankers are showing a slight strengthening in 2025, with an expected demand growth of 2.5%-3.5% and a supply/demand gap forecast at 4 percentage points. Product tankers, however, are weakening because fleet growth is outpacing demand; the supply/demand gap for this sector is forecast to be a much wider 12 percentage points in 2025.
High exit barriers exist because the assets-the vessels-have a long operational life, and repurposing specialized tankers is difficult. We see evidence of this aging fleet, as approximately 300 Aframax and Suezmax ships alone are set to turn 20 years old by 2028, but scrapping remains low due to current profitability, keeping capacity in the market. This means competitors are incentivized to stay in the fight rather than sell at a loss.
International Seaways, Inc. (INSW)'s strong profitability in the period shows that the market can support high performance, which definitely encourages competitors to maintain their capacity rather than exit. The company's Q3 2025 net income was $71 million, with an Adjusted EBITDA of $108 million for the quarter. This strong performance is reflected in their capital position, reporting total liquidity of $985 million and a net loan-to-value of 13% at the end of Q3 2025.
Here's a quick look at the financial performance that sets the competitive bar:
| Metric | International Seaways, Inc. (INSW) Q3 2025 Amount |
| Net Income (GAAP) | $71 million |
| Adjusted Net Income | $57 million |
| Adjusted EBITDA | $108 million |
| Free Cash Flow (Approximate) | $63 million |
| Total Liquidity (As of Q3 End) | $985 million |
The segment performance further illustrates the market divergence you're competing against:
- Suezmax spot earnings dropped from $38,000 per day (Q3 2024) to ~$33,300 per day (Q3 2025).
- LR1 spot earnings fell from ~$46,900 per day (Q3 2024) to ~$34,600 per day (Q3 2025).
- The company has over $230 million in contracted charter revenue remaining as of Q3 2025.
International Seaways, Inc. (INSW) - Porter's Five Forces: Threat of substitutes
The threat of substitutes for International Seaways, Inc. (INSW) centers on alternative methods of transporting the crude oil and petroleum products that form the backbone of its business. The most immediate substitute is a change in trade routes; a return to Red Sea/Suez Canal transits would shorten sailing distances and slash tonne-mile demand, which is the primary driver of tanker rates.
For context on market rate sensitivity, International Seaways, Inc.'s average spot earnings for the Suezmax sector in the third quarter of 2025 were approximately $33,300 per day, a decrease from $38,000 per day in the third quarter of 2024. Looking ahead, if ships cannot return to the Red Sea and Suez Canal in 2026, the supply and demand growth gap is estimated to narrow to 1 percentage point for crude tankers and 6 percentage points for product tankers. Conversely, if normal routings resume, tonne miles are forecast to fall 4.5%-5.5% in 2026, down from a forecast growth of 2.5%-3.5% in 2025.
New overland infrastructure presents a tangible, albeit currently limited, substitution threat. The Iran-China railway, launched on November 17, 2025, provides a new, sanctions-proof route that bypasses vulnerable sea lanes like the Strait of Malacca, through which approximately 80% of China's imported oil passes. This railway is capable of moving up to 3 million barrels of oil per month. This project is part of a larger $400 billion 25-year China-Iran partnership.
Pipelines and rail are generally not viable substitutes for the high-volume, intercontinental seaborne trade that is International Seaways, Inc.'s core business. While the new rail link is significant for specific bilateral trade, it does not yet possess the scale to replace the global tanker fleet for crude and product movements. However, the existence of such infrastructure changes the strategic calculus for energy security.
Long-term structural risk is high as the electrification trend accelerates. The International Energy Agency (IEA) Global EV Outlook 2025 projects that electric vehicles (EVs) are set to displace over 5 million barrels a day (mb/d) of diesel and gasoline globally by 2030. In 2024, EVs already cut oil demand by over 1.3 mb/d. The IEA's 2025 World Energy Outlook suggests global oil demand may peak at just over 105 million barrels a day in 2029. This trend is reflected in market pricing, with global oil prices dropping from an average of around USD 80 per barrel in 2024 to below USD 60 per barrel at one point in April 2025.
Alternative energy transport, specifically LNG shipping, represents a substitution threat for future energy flows, but not for current crude/product cargoes carried by International Seaways, Inc. The LNG tanker market is growing, with global trade volumes exceeding 400 million metric tons in 2023. As of 2024, over 700 LNG tankers were operating globally. International Seaways, Inc.'s fleet composition, which includes 41 MR tankers and 14 LR1s (including six newbuildings), is focused on refined products and crude, not LNG.
Here are key statistics related to the threat environment as of late 2025:
| Metric | Value/Amount | Context/Date |
|---|---|---|
| China-Iran Railway Oil Capacity | 3 million barrels per day | Monthly capacity, launched November 2025 |
| China Oil Import Vulnerability (Malacca) | 80% | Percentage of China's imported oil transiting the Strait of Malacca |
| IEA Projected Oil Displacement by EVs | 5 million barrels per day | Global displacement by 2030 |
| IEA Projected Global Oil Demand Peak | 105 million barrels per day | Projected peak year 2029 |
| Oil Price Low Point | Below USD 60 per barrel | April 2025 |
| INSW Q3 2025 Suezmax Spot Rate | $33,300 per day | Q3 2025 |
| INSW Fleet LR1 Newbuildings | 6 | As of Q1 2025 |
The shift in energy transport is also visible in the broader tanker market outlook:
- Tanker Shipping Market CAGR (2025-2033): 4.5%
- LNG Tankers Operating Globally: Over 700 (as of 2024)
- LNG Trade Volume: Exceeded 400 million metric tons (in 2023)
- Forecasted Product Tanker T/M Growth (2026): Fall of 4.5%-5.5%
The immediate threat from route changes is tied to geopolitical stability, as evidenced by the rate differential between Q3 2024 and Q3 2025. The long-term threat is structural, driven by global energy transition policies.
International Seaways, Inc. (INSW) - Porter's Five Forces: Threat of new entrants
The threat of new entrants for International Seaways, Inc. (INSW) remains relatively low, primarily due to the colossal financial and operational barriers to entry in the modern tanker industry. You see this clearly when you look at the sheer cost of acquiring modern, compliant assets.
Capital requirements are a massive barrier; newbuilding prices are near historical highs, and a new Very Large Crude Carrier (VLCC) costs over $100 million. Specifically, recent contracts for top-tier South Korean VLCC berths have been priced at about $129 million per vessel, based on a recent four-ship package deal. Even for a company like International Seaways, Inc., which maintains a very healthy balance sheet with a net loan-to-value ratio of only approximately 13% as of September 30, 2025, raising the initial capital for a new fleet is a monumental undertaking for any newcomer.
Regulatory hurdles are increasing dramatically with new environmental rules (e.g., IMO decarbonization targets) requiring significant capital investment in new vessel designs. While the IMO postponed a global emissions pricing mechanism in October 2025, the underlying pressure for cleaner operations is forcing massive CapEx. The container shipping sector, for example, has already committed $150 billion to decarbonization efforts. Any new entrant must factor in the cost of building ships capable of meeting future standards, not just current ones.
The current orderbook is large, especially for Suezmaxes (20.4%) and LR1/Panamaxes (16.6%) relative to their existing fleets, meaning new capacity is already scheduled to enter the market through 2027. The overall crude tanker orderbook-to-fleet ratio has hit a nine-year high of 14.1%. This scheduled influx of capacity, which is set to peak in deliveries in 2027, means a new entrant would be timing their entry against a known supply increase, potentially dampening immediate rate returns unless they are replacing older tonnage.
Establishing a reputation, securing financing (International Seaways, Inc.'s net loan-to-value is low at 13%), and building a global operational network are complex and time-consuming. It takes years to build the trust required for securing long-term, favorable charter contracts that underpin stable cash flow. New entrants lack this operational track record.
Access to skilled, compliant seafarers is a growing constraint, favoring established operators with existing crewing infrastructure. The transition to greener fuels and new technology means the industry needs significant upskilling. It is estimated that nearly half a million seafarers will require new training by 2030 to handle advanced fuel systems and safety protocols. Securing this trained manpower immediately upon fleet delivery is a significant logistical hurdle that an established operator like International Seaways, Inc. is better positioned to manage.
Here's a quick look at the current capacity overhang that new entrants face:
- Suezmax orderbook-to-fleet ratio: 20.4%
- LR1/Panamax orderbook-to-fleet ratio: 16.6%
- VLCC orderbook-to-fleet ratio: 13%
- Scheduled tanker deliveries peak: 2027
- Seafarer retraining need by 2030: Nearly 500,000
The capital outlay for a single modern VLCC is in the $129 million range, and the operational complexity around crewing and regulation adds layers of cost and risk that only deep-pocketed, experienced players can absorb effectively.
The required investment profile for a new entrant compared to an established operator like International Seaways, Inc. is stark:
| Barrier Component | New Entrant Requirement/Cost | International Seaways, Inc. (INSW) Metric (Late 2025) |
|---|---|---|
| VLCC Newbuilding Cost | Over $100 million (e.g., $129 million) | Acquired a 2020-built VLCC for $119 million |
| Financial Strength/Leverage | Need for substantial debt/equity financing | Net loan-to-value of approximately 13% |
| Regulatory Compliance Investment | Must fund new, likely dual-fuel designs | Container sector committed $150 billion to decarbonization |
| Operational Complexity (Crewing) | Need to establish crewing infrastructure | Requires training nearly 500,000 seafarers globally by 2030 |
Finance: draft 13-week cash view by Friday.
Disclaimer
All information, articles, and product details provided on this website are for general informational and educational purposes only. We do not claim any ownership over, nor do we intend to infringe upon, any trademarks, copyrights, logos, brand names, or other intellectual property mentioned or depicted on this site. Such intellectual property remains the property of its respective owners, and any references here are made solely for identification or informational purposes, without implying any affiliation, endorsement, or partnership.
We make no representations or warranties, express or implied, regarding the accuracy, completeness, or suitability of any content or products presented. Nothing on this website should be construed as legal, tax, investment, financial, medical, or other professional advice. In addition, no part of this site—including articles or product references—constitutes a solicitation, recommendation, endorsement, advertisement, or offer to buy or sell any securities, franchises, or other financial instruments, particularly in jurisdictions where such activity would be unlawful.
All content is of a general nature and may not address the specific circumstances of any individual or entity. It is not a substitute for professional advice or services. Any actions you take based on the information provided here are strictly at your own risk. You accept full responsibility for any decisions or outcomes arising from your use of this website and agree to release us from any liability in connection with your use of, or reliance upon, the content or products found herein.