
|
Jacobs Solutions Inc. (J): Análisis de la Matriz ANSOFF [Actualizado en Ene-2025] |
Completamente Editable: Adáptelo A Sus Necesidades En Excel O Sheets
Diseño Profesional: Plantillas Confiables Y Estándares De La Industria
Predeterminadas Para Un Uso Rápido Y Eficiente
Compatible con MAC / PC, completamente desbloqueado
No Se Necesita Experiencia; Fáciles De Seguir
Jacobs Solutions Inc. (J) Bundle
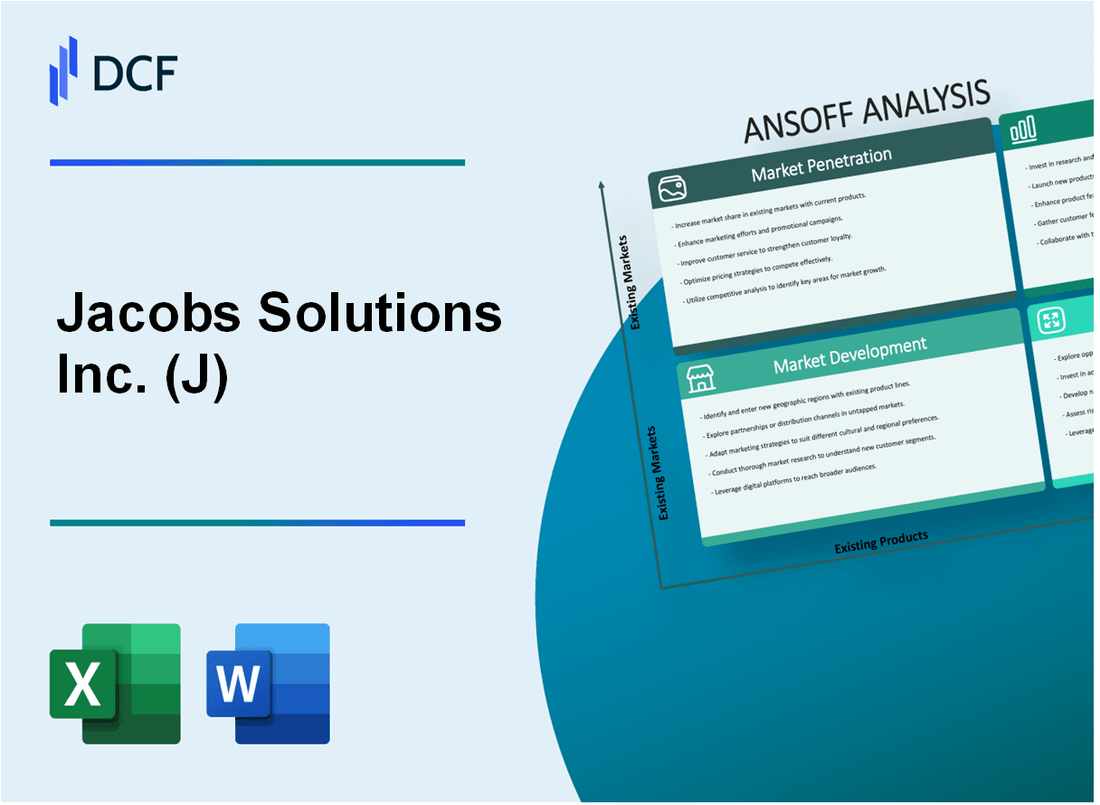
En el panorama en rápida evolución de la consultoría global de ingeniería y tecnología, Jacobs Solutions Inc. se encuentra en la encrucijada de la transformación estratégica, ejerciendo una matriz Ansoff meticulosamente elaborada que promete redefinir su enfoque de mercado. Al navegar estratégicamente por la penetración del mercado, el desarrollo, la innovación de productos y la diversificación audaz, la compañía está preparada para aprovechar las capacidades tecnológicas de vanguardia y expandir su huella global en múltiples sectores. Esta hoja de ruta dinámica no solo demuestra el compromiso de Jacobs con la excelencia tecnológica, sino que también indica un enfoque visionario para adaptarse y prosperar en un entorno empresarial cada vez más complejo y competitivo.
Jacobs Solutions Inc. (J) - Ansoff Matrix: Penetración del mercado
Expandir los servicios de consultoría de ingeniería dentro de la base de clientes gubernamentales e infraestructura existentes
Jacobs Solutions Inc. reportó $ 14.3 mil millones en ingresos totales para el año fiscal 2022, con segmentos de gobierno e infraestructura que representan el 42% de los ingresos totales.
| Segmento de clientes | Contribución de ingresos | Potencial de crecimiento |
|---|---|---|
| Gobierno federal | $ 3.2 mil millones | 5.7% de crecimiento proyectado |
| Infraestructura estatal/local | $ 2.6 mil millones | 4.3% de crecimiento proyectado |
Aumentar la venta cruzada de servicios técnicos y profesionales
Jacobs generó $ 4.8 mil millones de servicios técnicos y profesionales en 2022.
- Ingresos de servicios de consultoría técnica: $ 2.3 mil millones
- Ingresos de servicios de ingeniería profesional: $ 2.5 mil millones
Mejorar las ofertas de transformación digital
Se espera que el mercado de transformación digital alcance los $ 1.009 billones para 2025, con Jacobs apuntando al 8,2% de participación de mercado.
| Categoría de servicio digital | Valor de mercado actual | Crecimiento proyectado |
|---|---|---|
| Ingeniería digital | $ 365 millones | 12.4% CAGR |
| Infraestructura digital | $ 276 millones | 9.7% CAGR |
Implementar campañas de marketing dirigidas
Jacobs asignó $ 42.5 millones para marketing y desarrollo de negocios en 2022.
- Presupuesto de marketing digital: $ 18.3 millones
- Patrocinios de la conferencia técnica: $ 7.2 millones
Optimizar las estrategias de precios
El precio promedio actual del proyecto varía de $ 1.2 millones a $ 5.6 millones en diferentes segmentos de servicio.
| Segmento de servicio | Valor promedio del proyecto | Ajuste de la estrategia de precios |
|---|---|---|
| Consultoría de infraestructura | $ 3.4 millones | 2.5% Optimización de precios |
| Servicios técnicos | $ 2.7 millones | 3.1% Flexibilidad de precio |
Jacobs Solutions Inc. (J) - Ansoff Matrix: Desarrollo del mercado
Expandir la presencia geográfica en los mercados emergentes
Jacobs Solutions Inc. reportó $ 14.7 mil millones en ingresos totales para el año fiscal 2022, con mercados internacionales que contribuyeron al 37% de los ingresos totales. La penetración actual del mercado en India es del 12%, Medio Oriente al 9%y el sudeste asiático al 7%.
| Región | Cuota de mercado actual | Crecimiento proyectado | Asignación de inversión |
|---|---|---|---|
| India | 12% | 15.6% | $ 82 millones |
| Oriente Medio | 9% | 13.2% | $ 67 millones |
| Sudeste de Asia | 7% | 11.8% | $ 53 millones |
Proyectos de infraestructura gubernamental objetivo
El gasto en el proyecto de infraestructura global se estima en $ 4.5 billones anuales. Jacobs ha obtenido $ 1.2 mil millones en contratos de infraestructura gubernamental en 2022.
- Valor del contrato del proyecto gubernamental: $ 1.2 mil millones
- Crecimiento del proyecto de infraestructura proyectada: 6.3% anual
- Regiones con presencia actual limitada: África, Europa del Este
Desarrollar paquetes de servicio especializados
Se espera que el mercado de energía renovable alcance los $ 1.9 billones para 2030. Jacobs actualmente tiene $ 340 millones en contratos de servicios de energía renovable.
| Servicio vertical | Valor actual del contrato | Potencial de mercado |
|---|---|---|
| Energía solar | $ 145 millones | $ 680 mil millones |
| Energía eólica | $ 125 millones | $ 590 mil millones |
| Soluciones de hidrógeno | $ 70 millones | $ 220 mil millones |
Asociaciones estratégicas
Jacobs ha establecido 17 asociaciones estratégicas en 2022, expandiendo el alcance del mercado en 6 nuevos países.
- Número de nuevas asociaciones: 17
- Nuevos mercados geográficos ingresados: 6
- Inversión de asociación: $ 92 millones
Expansión de plataforma digital
Los ingresos por servicios digitales aumentaron en un 22% en 2022, llegando a $ 530 millones. Costo de adquisición del cliente en línea reducido en un 15%.
| Métrico digital | Rendimiento 2022 | Crecimiento año tras año |
|---|---|---|
| Ingresos del servicio digital | $ 530 millones | 22% |
| Adquisición de clientes en línea | Reducido en un 15% | Eficiencia de rentabilidad |
| Usuarios de plataforma digital | 42,000 | 28% |
Jacobs Solutions Inc. (J) - Ansoff Matrix: Desarrollo de productos
Invierte en soluciones avanzadas de ingeniería digital e inteligencia artificial
Jacobs Solutions Inc. invirtió $ 352 millones en I + D para tecnologías de ingeniería digital en el año fiscal 2022. La cartera de soluciones de IA de la compañía generó $ 487 millones en ingresos, lo que representa un crecimiento del 22% del año anterior.
| Categoría de inversión tecnológica | Monto de la inversión | Impacto de ingresos |
|---|---|---|
| Soluciones de IA de ingeniería digital | $ 352 millones | $ 487 millones |
| Plataformas de aprendizaje automático | $ 124 millones | $ 218 millones |
Desarrollar servicios especializados de consultoría de resiliencia climática y sostenibilidad
Jacobs asignó $ 267 millones para las capacidades de consultoría de resiliencia climática en 2022. Los servicios de sostenibilidad generaron $ 612 millones, con un crecimiento anual del 31%.
- Inversión de consultoría de resiliencia climática: $ 267 millones
- Ingresos de servicios de sostenibilidad: $ 612 millones
- Tasa de crecimiento: 31%
Crear plataformas de tecnología integradas
Jacobs desarrolló plataformas integradas que combinan tecnologías de ingeniería, digital y consultoría con una inversión de $ 412 millones. Estas plataformas generaron $ 785 millones en ingresos combinados.
| Tipo de plataforma | Inversión | Ganancia |
|---|---|---|
| Plataformas de tecnología integradas | $ 412 millones | $ 785 millones |
Mejorar las ofertas de consultoría de ciberseguridad y transformación digital
Jacobs invirtió $ 296 millones en consultoría de ciberseguridad y transformación digital. Estos servicios generaron $ 534 millones en ingresos con una tasa de crecimiento del 27%.
- Inversión de ciberseguridad: $ 178 millones
- Inversión de transformación digital: $ 118 millones
- Ingresos totales: $ 534 millones
- Tasa de crecimiento: 27%
Introducir tecnologías innovadoras de optimización ambiental e infraestructura
Jacobs comprometió $ 224 millones a tecnologías de optimización ambiental e infraestructura, generando $ 456 millones en ingresos de servicios relacionados.
| Categoría de tecnología | Inversión | Ganancia |
|---|---|---|
| Tecnologías ambientales | $ 124 millones | $ 256 millones |
| Optimización de infraestructura | $ 100 millones | $ 200 millones |
Jacobs Solutions Inc. (J) - Ansoff Matrix: Diversificación
Explore posibles adquisiciones en tecnología emergente y sectores de transformación digital
Jacobs Solutions Inc. invirtió $ 240 millones en adquisiciones de tecnología durante 2022. La compañía identificó a 7 compañías de tecnología potenciales para la adquisición estratégica en los sectores de transformación digital.
| Sector tecnológico | Potencial de inversión | Valor de mercado estimado |
|---|---|---|
| Consultoría de IA | $ 85 millones | $ 420 millones |
| Ciberseguridad | $ 65 millones | $ 310 millones |
| Infraestructura en la nube | $ 90 millones | $ 450 millones |
Desarrollar servicios integrales de adaptación climática y consultoría de resiliencia
Jacobs comprometió $ 175 millones al desarrollo del servicio de resiliencia climática en 2022. El tamaño actual del mercado para la consultoría de adaptación climática se estima en $ 42.3 mil millones a nivel mundial.
- Servicios de evaluación de riesgos climáticos
- Diseño de infraestructura sostenible
- Marcos de planificación de resiliencia
Invierta en tecnologías emergentes como la computación cuántica y la robótica avanzada
Asignación de inversión tecnológica: $ 120 millones para investigación cuántica e investigación de robótica en 2022-2023.
| Área tecnológica | Presupuesto de investigación | Crecimiento proyectado |
|---|---|---|
| Computación cuántica | $ 75 millones | Crecimiento anual del 24% |
| Robótica avanzada | $ 45 millones | 18% de crecimiento anual |
Crear nuevas líneas de servicio dirigidas a la exploración espacial y los sectores de tecnología avanzada
Jacobs asignó $ 95 millones para desarrollar líneas de exploración espacial y tecnología avanzada en 2022.
- Consultoría de infraestructura espacial
- Servicios avanzados de tecnología satelital
- Soluciones de ingeniería aeroespacial
Establecer un brazo de capital de riesgo para invertir en nuevas empresas tecnológicas innovadoras
Venture Capital Fund establecido con una inversión inicial de $ 300 millones. Rango de inversión objetivo: $ 5-25 millones por startup.
| Categoría de inicio | Rango de inversión | Retorno esperado |
|---|---|---|
| Startups de tecnología profunda | $ 10-20 millones | 15-22% potencial ROI |
| Tecnología limpia | $ 5-15 millones | 12-18% potencial ROI |
Jacobs Solutions Inc. (J) - Ansoff Matrix: Market Penetration
You're looking at how Jacobs Solutions Inc. (J) can grab more of the existing market pie right now. That's Market Penetration, and the numbers show where the immediate focus is.
The first action is capturing a bigger slice of the massive US Critical Infrastructure Serviceable Addressable Market (SAM). That SAM is estimated to be worth $390 billion across Energy and Power, Transportation, and Cities and Places. You need to convert more of that addressable spend into secured work for Jacobs Solutions Inc. (J).
Next, you're pushing high-margin PA Consulting services deeper into the existing Infrastructure & Advanced Facilities client base. For Q2 FY25, PA Consulting showed solid momentum, delivering 5% revenue growth in that quarter alone. That segment's operating profit growth was even stronger at 12% in Q2 FY25, showing the margin benefit of cross-selling that consulting expertise.
Driving digital integration across current projects is key to increasing the value of each contract and making clients stick around. While specific digital adoption metrics aren't public, the overall success in securing future work is clear from the backlog growth. The trailing 12-month book-to-bill ratio hit 1.3x in Q2 FY25, meaning you are booking work faster than you are completing it.
A major focus is turning the existing pipeline into recognized revenue quickly. The sales efforts must concentrate on converting the record backlog, which stood at $23.1 billion at one recent point, into faster revenue recognition. This backlog growth, up 20% year-over-year at the end of Q2 FY25, provides strong visibility for near-term performance.
Finally, boosting bid-win rates in the Life Sciences sector ties directly into profitability. In Q2 FY25, the adjusted EPS reached $1.43, representing growth of over 22% compared to the prior year's quarter. You are targeting that sector growth, which saw Life Sciences and Advanced Manufacturing gross revenues increase 5.3% year-over-year in Q4 FY2025. The overall company reaffirmed its full-year adjusted EPS guidance range of $5.85-$6.20.
Here are some key financial metrics supporting this penetration strategy:
| Metric | Value | Period/Context |
| US Critical Infrastructure SAM | $390 billion | Estimated Market Size |
| Q2 FY25 PA Consulting Revenue Growth | 5% | Year-over-Year |
| Q2 FY25 Backlog | $22.2 billion | Reported End of Q2 FY25 |
| Q2 FY25 Adjusted EPS | $1.43 | Reported Q2 FY25 |
| Q2 FY25 Book-to-Bill (TTM) | 1.3x | Trailing Twelve Months |
Actions to drive immediate market share gains include:
- Targeting the $390 billion US Critical Infrastructure SAM.
- Cross-selling PA Consulting services showing 5% Q2 revenue growth.
- Converting the $23.1 billion backlog into recognized revenue.
- Leveraging Q2 adjusted EPS of $1.43 for Life Sciences bids.
Finance: draft 13-week cash view by Friday.
Jacobs Solutions Inc. (J) - Ansoff Matrix: Market Development
Market development for Jacobs Solutions Inc. (J) centers on taking existing, proven capabilities into new geographies or new client segments within existing geographies. You are looking at deploying established expertise where the addressable market is large and currently under-tapped by the firm.
Expand the Water and Environmental solutions, a $220 billion SAM, into new, water-stressed regions like the Middle East or North Africa. Jacobs Solutions Inc. generated $596.33 million in revenue from the Middle East and Africa region in fiscal year 2025, which grew by 11.15% year-over-year. The broader Middle East Water and Waste Water Market was valued at approximately $7.02851 billion in 2024. The competitive landscape shows activity, such as Toray launching a Water Treatment Technology Center in Saudi Arabia in June 2025, indicating active investment in the region.
Target new public-sector clients in Europe for existing transportation and energy security consulting services. Jacobs Solutions Inc.'s Europe revenue for fiscal year 2025 was $2.87 billion, representing a 6.78% year-over-year increase. The firm is already active, supporting the Copenhagen Metro with strategic management and technical services. Furthermore, the Infrastructure & Advanced Facilities (I&AF) segment, which includes Transportation, saw revenue growth driven by sectors like Energy & Power in fiscal year 2025.
Establish a dedicated sales channel to bring the existing semiconductor and data center expertise to emerging Asian manufacturing hubs. Jacobs Solutions Inc.'s revenue from the Asia region in fiscal year 2025 was $144.94 million, showing a 9.26% year-over-year increase. The I&AF segment's growth in fiscal year 2025 was supported by strength in the Data Center sector, which is a key area to push into new Asian manufacturing geographies.
Use the strong balance sheet to acquire small, regional engineering firms to gain immediate market access in defintely underpenetrated US states. Jacobs Solutions Inc. ended fiscal year 2025 with a current ratio of 1.39 and a debt-to-equity ratio of 0.79, signaling a stable position for strategic investment. The company has $1.2 billion in cash and short-term investments available. Jacobs Solutions Inc. delivered a record $1.1 billion of capital back to shareholders during FY25, demonstrating capacity for capital deployment.
Introduce the PA Consulting segment's advisory model to new government agencies outside its current UK/US core. The PA Consulting segment generated $1.27 billion in revenue in fiscal year 2025, with Q4 2025 revenue at $318.46 million, a 10% year-over-year increase for the quarter. The CEO noted seeing strong results in PA Consulting during the fiscal year, driving 12% operating profit growth for the segment.
Here's a quick math summary of the current state you are building upon:
| Metric | Value | Context / Year |
| Total Gross Revenue | $12.0 billion | FY 2025 |
| PA Consulting Revenue | $1.27 billion | FY 2025 |
| I&AF Revenue | $10.76 billion | FY 2025 |
| Total Backlog | $23.1 billion | End of FY 2025 |
| Cash & Short-Term Investments | $1.2 billion | As of Q4 2025 |
| Europe Revenue | $2.87 billion | FY 2025 |
To keep the momentum you've built, focus on these operational indicators:
- FY 2025 Adjusted EBITDA Margin tracking near 13.9%.
- FY 2025 Adjusted EPS was $6.12.
- FY 2026 Adjusted Net Revenue growth projected between 6% and 10%.
- Q4 Book-to-Bill Ratio was 1.1x (TTM).
- The firm is starting FY26 with a record backlog.
Finance: draft 13-week cash view by Friday.
Jacobs Solutions Inc. (J) - Ansoff Matrix: Product Development
You're looking at how Jacobs Solutions Inc. is developing new offerings for its existing client base, which is the Product Development quadrant of the Ansoff Matrix. This strategy relies on their current market strength, which in fiscal year 2025 saw Infrastructure & Advanced Facilities (I&AF) generate $10.76 Billion in revenue, making up 89.48% of the total $12.03B gross revenue for the year.
Develop AI-driven predictive maintenance platforms for existing Critical Infrastructure clients to address AI demand.
This focus leverages the company's digital push, evidenced by working with partners like NVIDIA and Palantir to deploy AI-driven tools, such as digital twins for data centers. The success of this digital shift is reflected in the 15.9% increase in adjusted Earnings Per Share (EPS) to $6.12 in fiscal year 2025. The Critical Infrastructure serviceable addressable market (SAM) is estimated at $390 billion, with AI demand being a key opportunity driver.
Launch a new suite of nature-based solutions and digital tools for water scarcity challenges in current environmental markets.
Jacobs Solutions Inc. is targeting the Water and Environmental market, which has an estimated SAM of $220 billion. This new suite directly addresses water scarcity and wastewater challenges within that market. The company's overall adjusted net revenue for FY2025 was $8.7 billion, up 5.3% year-over-year.
Invest R&D capital into advanced manufacturing clients for new cleanroom and process automation technologies.
This investment targets the Life Sciences and Advanced Manufacturing SAM, estimated at $120 billion, which includes opportunities from semiconductors and broader manufacturing expansion. The Infrastructure & Advanced Facilities segment, which includes advanced manufacturing clients, drove revenue growth in FY25.
Create a specialized consulting service focused solely on energy transition and grid modernization for existing power clients.
This is directly supported by recent major wins, such as being named Program Manager and Owners Engineer for Xcel Energy to support their $45 billion investment plan aimed at grid modernization. This positions Jacobs Solutions Inc. to capture more opportunities as utilities nationwide undertake similar grid modernization programs, building on momentum from hydrogen infrastructure and solar projects.
Offer new cyber resiliency and cloud transformation services to existing government and defense clients.
The commitment to government and defense is substantial, demonstrated by winning a contract valued at up to $1.5 billion for environmental services with the U.S. Air Force. This win underscores their capability in delivering complex infrastructure resilience solutions, including cyber networks, for federal agencies under contracts like the GSA OASIS+ MAC.
Here's a quick look at the scale of the business and the markets being addressed:
| Metric | Value (FY2025) | Context |
| Total Gross Revenue | $12.0 Billion | Fiscal Year 2025 Total |
| Total Backlog | $23.1 Billion | Record level, up 5.6% y/y |
| Adjusted EBITDA | $1.2 Billion | Increased 13.9% y/y |
| Water & Environmental SAM | $220 Billion | Market for water scarcity solutions |
| Critical Infrastructure SAM | $390 Billion | Market including energy and power |
| Xcel Energy Program Value | $45 Billion | Grid modernization investment supported by Jacobs |
The growth in these product offerings is supported by the overall financial performance, which saw adjusted net revenue of $8.7 billion. Management anticipates continued growth, guiding for adjusted net revenue to grow 6% to 10% over fiscal 2025 for the next fiscal year.
Key areas driving the need for these new products include:
- Life Sciences, Data Center, Water, Energy & Power, and Transportation sector growth within I&AF.
- The push for grid modernization and energy security.
- The need for resilient infrastructure, as seen in the $1.5 billion Air Force environmental contract.
- Digital integration across end markets.
The focus on technology-enabled solutions helped drive adjusted EPS up 15.9% to $6.12 in FY25. To be fair, the GAAP net earnings decreased (48.9)% to $313 million, impacted by mark-to-market losses related to the Amentum stock stake. Still, cash conversion and reported free cash flow conversion exceeded 100%.
Finance: draft 13-week cash view by Friday.
Jacobs Solutions Inc. (J) - Ansoff Matrix: Diversification
Jacobs Solutions Inc. (J) is looking at new frontiers, moving beyond its core engineering and consulting base into markets that offer different revenue profiles, like recurring software fees or project equity stakes. This diversification strategy uses the strong financial footing built in fiscal year 2025 to enter these new product-new market quadrants.
Acquire a pure-play software-as-a-service (SaaS) company to enter the recurring revenue software market.
Moving into pure-play SaaS means shifting from project-based billing to predictable, recurring revenue streams. This aligns with the company's stated focus on digital solutions, which saw its Life Sciences and Advanced Manufacturing sector tapping into an estimated $120 billion serviceable addressable market (SAM) in fiscal 2025. The goal here is to capture a higher multiple associated with software businesses, contrasting with the current business model where the fiscal 2025 Adjusted EBITDA was $1.2 billion on $8.7 billion in adjusted net revenue.
Form a joint venture to deliver end-to-end project financing and development, moving beyond just consulting and design.
This move into project financing introduces a capital-at-risk element, potentially offering higher returns than pure-play services. The company is clearly focused on capital deployment, having returned a record $1.1 billion to shareholders in fiscal 2025 through repurchases and dividends, and announcing a new $1.5 billion share repurchase authorization. A joint venture structure would allow Jacobs Solutions Inc. (J) to participate in the financial upside of large infrastructure projects, which are part of the $390 billion SAM in Critical Infrastructure.
Leverage the $1.2 billion Adjusted EBITDA for M&A in the adjacent, high-growth space of urban air mobility infrastructure.
The $1.2 billion Adjusted EBITDA for fiscal 2025 is the foundation for strategic mergers and acquisitions (M&A) outside the core. Urban air mobility infrastructure represents a new product/service offering in a nascent market. This strategy is supported by a strong balance sheet, as the fiscal 2025 free cash flow conversion exceeded 100% of net income. The company's current financial strength is underscored by a fiscal 2025 Net Margin of 2.41% and a Return on Equity of 19.14%.
Launch a new, proprietary technology platform for digital supply chain management in the Life Sciences sector.
This is a product development play within an existing market. Digital supply chain management for Life Sciences is a specialized offering targeting the sector where Jacobs Solutions Inc. (J) already sees significant opportunity. The company's overall backlog reached a record $23.1 billion at the end of fiscal 2025, showing strong demand visibility for its current offerings, which can serve as a launchpad for new digital products.
- Life Sciences and Advanced Manufacturing SAM: $120 billion
- FY 2025 Adjusted Net Revenue Growth: 5.3% year-over-year
- FY 2026 Adjusted EPS Guidance Midpoint: Approximately $7.100
- FY29 Adjusted EBITDA Margin Target: 16%+
Target the new market of commercial space infrastructure with a new, specialized engineering and program management offering.
Entering commercial space infrastructure is a pure diversification move, introducing both a new market and a specialized service offering. This leverages the firm's expertise in complex program management, similar to its work in Critical Infrastructure. The company has set a long-term goal for organic adjusted net revenue growth of 6% to 8% CAGR through fiscal 2029, which this new market entry is intended to supplement.
Here's a quick look at the scale of the existing adjacent markets versus the potential for diversification:
| Market Focus Area | Serviceable Addressable Market (SAM) | FY 2025 Adj. EBITDA Contribution Context | Diversification Strategy Alignment |
| Water and Environmental | $220 billion | Context for M&A/JV Scale | SaaS/Financing JV |
| Life Sciences and Advanced Manufacturing | $120 billion | Context for New Product Launch | Proprietary Tech Platform |
| Critical Infrastructure | $390 billion | Context for M&A/JV Scale | UAM Infrastructure M&A |
| Commercial Space Infrastructure | Not Stated | Context for New Market Entry | New Specialized Offering |
The current quarterly dividend stands at $0.32 per share, with a payout ratio of 52.89%, showing capacity for capital deployment elsewhere, such as the $1.5 billion share repurchase authorization. The Q4 2025 Adjusted EBITDA was $324 million, indicating strong recent performance momentum heading into these diversification efforts. If onboarding takes 14+ days for a new SaaS integration, churn risk rises, defintely something to watch.
Disclaimer
All information, articles, and product details provided on this website are for general informational and educational purposes only. We do not claim any ownership over, nor do we intend to infringe upon, any trademarks, copyrights, logos, brand names, or other intellectual property mentioned or depicted on this site. Such intellectual property remains the property of its respective owners, and any references here are made solely for identification or informational purposes, without implying any affiliation, endorsement, or partnership.
We make no representations or warranties, express or implied, regarding the accuracy, completeness, or suitability of any content or products presented. Nothing on this website should be construed as legal, tax, investment, financial, medical, or other professional advice. In addition, no part of this site—including articles or product references—constitutes a solicitation, recommendation, endorsement, advertisement, or offer to buy or sell any securities, franchises, or other financial instruments, particularly in jurisdictions where such activity would be unlawful.
All content is of a general nature and may not address the specific circumstances of any individual or entity. It is not a substitute for professional advice or services. Any actions you take based on the information provided here are strictly at your own risk. You accept full responsibility for any decisions or outcomes arising from your use of this website and agree to release us from any liability in connection with your use of, or reliance upon, the content or products found herein.