
|
Valoración DCF de Jacobs Solutions Inc. (J) |
Completamente Editable: Adáptelo A Sus Necesidades En Excel O Sheets
Diseño Profesional: Plantillas Confiables Y Estándares De La Industria
Predeterminadas Para Un Uso Rápido Y Eficiente
Compatible con MAC / PC, completamente desbloqueado
No Se Necesita Experiencia; Fáciles De Seguir
Jacobs Solutions Inc. (J) Bundle
¡Agilice su análisis y mejore la precisión con nuestra (J) DCF Calculadora! Utilizando datos reales de Jacobs Solutions Inc. y suposiciones personalizables, esta herramienta le permite pronosticar, analizar y evaluar (j) como un inversor experimentado.
What You Will Receive
- Pre-Built Financial Model: Jacobs Solutions Inc.'s actual data provides an accurate DCF valuation.
- Comprehensive Forecast Control: Modify revenue growth, profit margins, WACC, and other essential factors.
- Real-Time Calculations: Automatic updates allow you to view results instantly as adjustments are made.
- Professional-Grade Template: A polished Excel file crafted for high-quality valuation presentations.
- Flexible and Reusable: Designed for adaptability, enabling repeated use for in-depth forecasts.
Key Features
- Comprehensive DCF Calculator: Offers intricate unlevered and levered DCF valuation models tailored for Jacobs Solutions Inc. (J).
- WACC Calculator: Features a pre-configured Weighted Average Cost of Capital sheet with adjustable parameters.
- Customizable Forecast Assumptions: Adjust growth projections, capital expenditures, and discount rates as needed.
- Integrated Financial Ratios: Evaluate profitability, leverage, and efficiency ratios specifically for Jacobs Solutions Inc. (J).
- Interactive Dashboard and Charts: Visual representations provide a summary of essential valuation metrics for straightforward analysis.
How It Works
- 1. Access the Template: Download and open the Excel file featuring Jacobs Solutions Inc.'s (J) preloaded data.
- 2. Adjust Assumptions: Modify key inputs such as growth rates, WACC, and capital expenditures.
- 3. View Results in Real-Time: The DCF model automatically calculates the intrinsic value and NPV.
- 4. Explore Scenarios: Evaluate multiple forecasts to assess various valuation outcomes.
- 5. Present with Assurance: Deliver professional valuation insights to enhance your decision-making.
Why Choose Jacobs Solutions Inc. (J) Calculator?
- Accurate Insights: Utilize real Jacobs Solutions Inc. financial data for dependable valuation outcomes.
- Flexible Options: Tailor essential variables such as growth rates, WACC, and tax rates to fit your forecasts.
- Efficiency Boost: Built-in calculations save you time by avoiding the need to create from the ground up.
- Professional-Quality Resource: Crafted for the needs of investors, analysts, and consultants.
- Easy to Use: User-friendly design and clear, step-by-step guidance make it accessible for everyone.
Who Should Use Jacobs Solutions Inc. (J)?
- Investors: Evaluate Jacobs Solutions Inc.'s valuation prior to making investment decisions.
- CFOs and Financial Analysts: Optimize valuation methodologies and assess financial forecasts.
- Startup Founders: Understand the valuation strategies of established companies like Jacobs Solutions Inc.
- Consultants: Provide detailed valuation analyses and reports for clients interested in Jacobs Solutions Inc.
- Students and Educators: Utilize current data to learn and teach valuation principles related to Jacobs Solutions Inc.
What the Template Contains
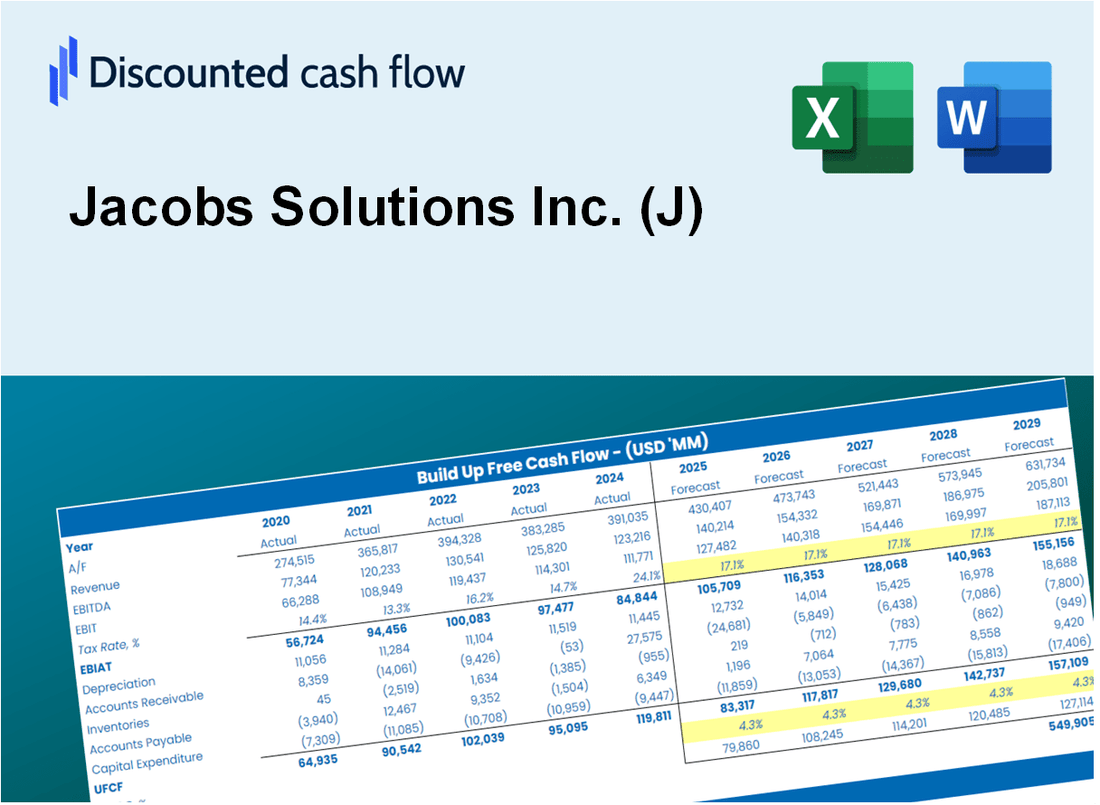
- Preloaded J Data: Historical and projected financial data, including revenue, EBIT, and capital expenditures.
- DCF and WACC Models: Professional-grade sheets for calculating intrinsic value and Weighted Average Cost of Capital.
- Editable Inputs: Yellow-highlighted cells for adjusting revenue growth, tax rates, and discount rates.
- Financial Statements: Comprehensive annual and quarterly financials for deeper analysis.
- Key Ratios: Profitability, leverage, and efficiency ratios to evaluate performance.
- Dashboard and Charts: Visual summaries of valuation outcomes and assumptions.
Disclaimer
All information, articles, and product details provided on this website are for general informational and educational purposes only. We do not claim any ownership over, nor do we intend to infringe upon, any trademarks, copyrights, logos, brand names, or other intellectual property mentioned or depicted on this site. Such intellectual property remains the property of its respective owners, and any references here are made solely for identification or informational purposes, without implying any affiliation, endorsement, or partnership.
We make no representations or warranties, express or implied, regarding the accuracy, completeness, or suitability of any content or products presented. Nothing on this website should be construed as legal, tax, investment, financial, medical, or other professional advice. In addition, no part of this site—including articles or product references—constitutes a solicitation, recommendation, endorsement, advertisement, or offer to buy or sell any securities, franchises, or other financial instruments, particularly in jurisdictions where such activity would be unlawful.
All content is of a general nature and may not address the specific circumstances of any individual or entity. It is not a substitute for professional advice or services. Any actions you take based on the information provided here are strictly at your own risk. You accept full responsibility for any decisions or outcomes arising from your use of this website and agree to release us from any liability in connection with your use of, or reliance upon, the content or products found herein.