|
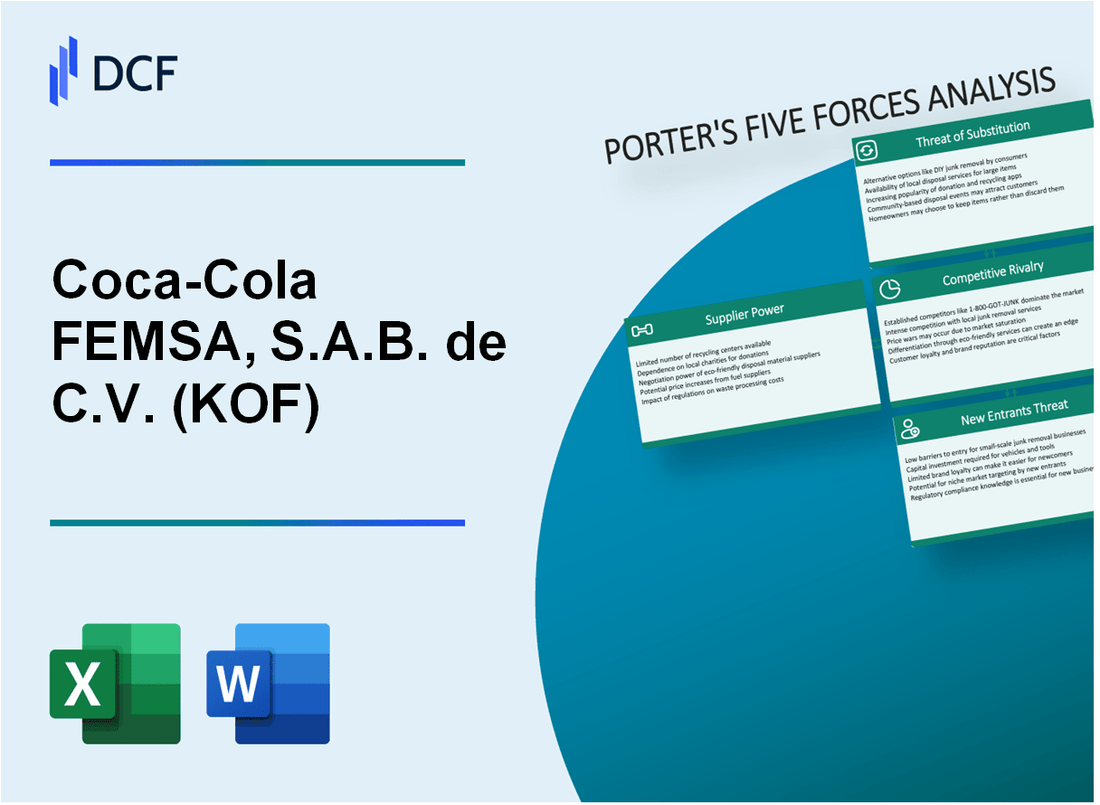
Análisis de las 5 Fuerzas de Coca-Cola FEMSA, S.A.B. de C.V. (KOF): [Actualizado en enero de 2025] |
Completamente Editable: Adáptelo A Sus Necesidades En Excel O Sheets
Diseño Profesional: Plantillas Confiables Y Estándares De La Industria
Predeterminadas Para Un Uso Rápido Y Eficiente
Compatible con MAC / PC, completamente desbloqueado
No Se Necesita Experiencia; Fáciles De Seguir
Coca-Cola FEMSA, S.A.B. de C.V. (KOF) Bundle
En el mundo dinámico de la fabricación de bebidas, Coca-Cola FEMSA navega por un complejo paisaje competitivo formado por las cinco fuerzas estratégicas de Michael Porter. Desde luchar contra los proveedores globales y la evolución de las preferencias de los clientes hasta la gestión de rivalidades intensas del mercado y alternativas de bebidas emergentes, este análisis revela los desafíos estratégicos y las oportunidades que enfrenta una de las compañías de embotellado más grandes de América Latina. Comprender estas dinámicas competitivas revela cómo Coca-Cola FEMSA mantiene su liderazgo en el mercado en un ecosistema de bebidas cada vez más sofisticado y consciente de la salud.
Coca-Cola Femsa, S.A.B. de C.V. (KOF) - Las cinco fuerzas de Porter: poder de negociación de los proveedores
Paisaje de proveedores de concentración y envasado global
A partir de 2024, Coca-Cola FEMSA se basa en un número limitado de proveedores globales para las entradas de producción de bebidas críticas.
| Categoría de proveedor | Número de proveedores globales | Concentración de mercado |
|---|---|---|
| Concentrados proveedores | 3-4 principales proveedores globales | Cuota de mercado del 85% |
| Materiales de embalaje | 5-6 Fabricantes mundiales primarios | 72% de concentración de mercado |
| Proveedores de materia prima | 8-10 proveedores globales significativos | 65% de participación de mercado |
Costos de cambio y dinámica de la cadena de suministro
Coca-Cola Femsa enfrenta costos de cambio significativos para los proveedores:
- Costo estimado de transición del proveedor: $ 15.2 millones por cambio de proveedor
- Proceso de calificación promedio de proveedores: 18-24 meses
- Requisitos de certificación técnica: estándares estrictos de control de calidad
Impacto en el costo de la materia prima
| Materia prima | Costo de adquisición anual | Volatilidad de los precios |
|---|---|---|
| Azúcar | $ 327 millones | 12-15% fluctuación anual |
| Aluminio | $ 215 millones | 8-10% Variación anual |
| Plástico | $ 189 millones | Cambios de precios anuales de 7-9% |
Control de la cadena de suministro de Coca-Cola Company
La compañía Coca-Cola mantiene un control estricto sobre el jarabe y el suministro de concentrados, con el 98.7% de la producción de concentrados globales administrados directamente por la empresa matriz.
- Porcentaje de integración vertical: 97.3%
- Control de fórmula de concentrado patentado: 100%
- Cumplimiento de auditoría del proveedor global: 99.5%
Coca-Cola Femsa, S.A.B. de C.V. (KOF) - Las cinco fuerzas de Porter: poder de negociación de los clientes
Gran base de clientes diversos
Coca-Cola FEMSA sirve a 10 países en América Latina, con una base de clientes que incluye:
- 375,000 puntos minoristas directos de venta
- 47,000 restaurantes y establecimientos de servicio de alimentos
- 3.500 distribuidores a gran escala
Análisis de sensibilidad de precios
| Mercado | Elasticidad de precio | Gasto promedio del consumidor |
|---|---|---|
| México | -1.2 | $ 5.40 por bebida |
| Brasil | -0.9 | $ 4.75 por bebida |
| Argentina | -1.5 | $ 3.85 por bebida |
Tendencias de preferencia del consumidor
Crecimiento del segmento de bebidas más saludables:
- Bebidas bajas/sin azúcar: cuota de mercado del 22% en 2023
- Ventas de agua embotellada: $ 1.2 mil millones en 2023
- Mercado de bebidas funcionales: 15.7% de tasa de crecimiento anual
Fragmentación del canal de distribución
Panorama de distribución en los países operativos:
| País | Número de canales de distribución | Penetración del mercado |
|---|---|---|
| México | 125,000 | 98.5% |
| Brasil | 85,000 | 96.3% |
| Colombia | 45,000 | 92.7% |
Coca-Cola Femsa, S.A.B. de C.V. (KOF) - Las cinco fuerzas de Porter: rivalidad competitiva
Competencia de mercado Overview
A partir de 2024, Coca-Cola Femsa enfrenta una intensa rivalidad competitiva en el mercado de bebidas con los siguientes competidores clave:
| Competidor | Cuota de mercado | Regiones clave |
|---|---|---|
| Pepsico | 28.7% | América Latina, México |
| Fabricantes de bebidas locales | 15.4% | Brasil, Argentina, Colombia |
| Coca-Cola Femsa | 45.2% | Múltiples países latinoamericanos |
Análisis de paisaje competitivo
Métricas de intensidad competitiva para Coca-Cola Femsa revelan:
- Número de competidores directos: 12
- Ratio de concentración de mercado: 73.9%
- Tasa anual de innovación de productos: 6.5 productos nuevos por año
Variaciones del mercado regional
| País | Intensidad de la competencia del mercado | Presencia de marca local |
|---|---|---|
| México | Alto (87%) | Marcas regionales fuertes |
| Brasil | Moderado (65%) | Fabricantes locales emergentes |
| Argentina | Alto (79%) | Competencia local significativa |
Métricas de innovación de productos
Inversión de innovación: $ 127.3 millones anuales
- Presupuesto de investigación y desarrollo: $ 42.6 millones
- Frecuencia de lanzamiento de nuevos productos: trimestralmente
- Tiempo de mercado promedio: 8.2 meses
Gasto de estrategia de marketing
Desglose de inversión de marketing:
| Canal de marketing | Gasto anual | Porcentaje de presupuesto |
|---|---|---|
| Marketing digital | $ 53.4 millones | 42% |
| Medios tradicionales | $ 39.2 millones | 31% |
| Patrocinios | $ 33.7 millones | 27% |
Coca-Cola Femsa, S.A.B. de C.V. (KOF) - Las cinco fuerzas de Porter: amenaza de sustitutos
El creciente cambio de los consumidores hacia las bebidas conscientes de la salud
En 2023, el mercado mundial de bebidas de salud y bienestar alcanzó los $ 196.5 mil millones, con una tasa compuesta anual proyectada de 7.2% de 2024 a 2030.
| Segmento de mercado | Valor de mercado 2023 (mil millones de dólares) | Índice de crecimiento |
|---|---|---|
| Bebidas bajas en azúcar | 52.3 | 8.5% |
| Bebidas funcionales | 41.7 | 6.9% |
| Bebidas a base de plantas | 32.6 | 9.2% |
Aumento de la popularidad del agua, el té y las bebidas energéticas
El tamaño del mercado global del agua embotellada alcanzó los $ 217.8 mil millones en 2023, con un crecimiento proyectado de 6.7% anual.
- Consumo de agua embotellada: 391.8 mil millones de litros en todo el mundo en 2023
- Valor de mercado de las bebidas energéticas: $ 86.4 mil millones en 2023
- Ingresos globales del mercado de té: $ 55.8 mil millones en 2023
Aumento de alternativas de bebidas locales y artesanales
El mercado de bebidas artesanales en América Latina se expandió a $ 12.6 mil millones en 2023, con un crecimiento de 9.3% año tras año.
| Tipo de bebida | Cuota de mercado 2023 | Índice de crecimiento |
|---|---|---|
| Bebidas artesanales locales | 17.5% | 11.2% |
| Refrescos artesanales | 8.3% | 7.6% |
Opciones emergentes de bebidas no carbonatadas y de bajo azúcar
Mercado de bebidas no carbonatadas valorado en $ 124.5 mil millones en 2023, con variantes de bajo azúcar que representan el 37.6% del mercado total.
- Crecimiento del mercado de bebidas de bajo azúcar: 10.2% anual
- Consumo de bebidas no carbonatadas: 267.3 mil millones de litros en 2023
- Valor de mercado de Kombucha: $ 3.2 mil millones a nivel mundial en 2023
Coca-Cola Femsa, S.A.B. de C.V. (KOF) - Las cinco fuerzas de Porter: amenaza de nuevos participantes
Altos requisitos de capital para la infraestructura de producción de bebidas
La infraestructura de producción de bebidas de Coca-Cola Femsa requiere una inversión de capital sustancial. A partir de 2023, la compañía opera 53 plantas de producción en múltiples países con una capacidad de producción total de 4.100 millones de casos de unidades anuales.
| Gasto de capital (2022) | Instalaciones de fabricación | Capacidad de producción |
|---|---|---|
| $ 701.4 millones | 53 plantas | 4.100 millones de casos unitarios |
Fuerte lealtad a la marca a Coca-Cola y marcas establecidas
Coca-Cola FEMSA mantiene un dominio significativo en el mercado con una cuota de mercado de 55.4% en sus territorios operativos en América Latina.
- Cuota de mercado en México: 64.3%
- Cuota de mercado en Brasil: 51.2%
- Cuota de mercado en Colombia: 58.7%
Redes de distribución compleja y cumplimiento regulatorio
La compañía administra una red de distribución extensa que cubre 10 países con más de 1.7 millones de puntos activos de venta.
| País | Canales de distribución | Puntos de venta activos |
|---|---|---|
| México | Directo e indirecto | 620,000 |
| Brasil | Red integral | 450,000 |
Economías de escala significativas en la fabricación de bebidas
Coca-Cola FEMSA logró ventas netas consolidadas de $ 12.7 mil millones en 2022, lo que demuestra economías de escala sustanciales.
- Volumen total vendido: 3.500 millones de casos de unidad
- Ingresos operativos: $ 12.7 mil millones
- Eficiencia de rentabilidad: 22.3% margen operativo
Coca-Cola FEMSA, S.A.B. de C.V. (KOF) - Porter's Five Forces: Competitive rivalry
You're looking at the competitive landscape for Coca-Cola FEMSA, S.A.B. de C.V. (KOF), and rivalry is definitely the main event here. It's an intense fight, primarily against the bottlers aligned with PepsiCo, and your most significant direct peer in the region is Arca Continental. These players are constantly battling for shelf space and consumer preference across Latin America.
Coca-Cola FEMSA, S.A.B. de C.V. remains the largest Coca-Cola franchise bottler globally by sales volume, but the competition is closing in on scale and investment. For instance, Arca Continental announced an investment of approximately Ps. 18 billion across its operations for 2025 to bolster its own capabilities. This signals that the rivalry isn't just about current sales; it's about who invests more aggressively for future market share.
The intensity of the rivalry is clearly reflected in the recent volume performance. Coca-Cola FEMSA, S.A.B. de C.V.'s consolidated volume declined 5.5% in the second quarter of 2025, falling to 1,035.3 million unit cases. While the third quarter showed sequential improvement with a 0.6% decline to 1,035.0 million unit cases, the underlying pressure is evident, especially with Mexico volume declining 3.7% in Q3 2025.
Competition focuses heavily on the nuts and bolts of getting product to the customer and making it visible. Distribution efficiency and marketing spend are where the battles are won or lost. You see this in Coca-Cola FEMSA, S.A.B. de C.V.'s operational focus; management noted expense efficiencies in marketing across operations during the third quarter of 2025. Furthermore, the ambition to install a new record of 125,000 coolers during the year speaks directly to the focus on point-of-sale execution and distribution dominance.
Here's a quick look at the scale of the key players based on the latest available full-year and quarterly data, which helps frame the rivalry:
| Metric | Coca-Cola FEMSA, S.A.B. de C.V. (KOF) | Arca Continental (AC) |
| Latest Reported Volume (Unit Cases) | Q3 2025: 1,035.0 million | 2024: Surpassed 2,466 million |
| Latest Reported Revenue (Ps.) | Q3 2025: MXN 71.9 billion | 2024: Ps. 237,004 million |
| 2025 Investment Plan (Ps.) | Not explicitly detailed for 2025 in this context | Approximately Ps. 18 billion |
| Operating Margin | Q3 2025: 14.3% (Expanded 50 basis points) | 2024: Highest consolidated margin in the past eight years |
The rivalry is a constant push-pull between volume defense and margin protection. While Coca-Cola FEMSA, S.A.B. de C.V. is the largest bottler, Arca Continental is the second-largest in the Americas and is clearly signaling aggressive intent with its Ps. 18 billion investment plan for 2025.
The competitive dynamics also involve product mix and regional performance. While Mexico saw a volume contraction, South America showed resilience, with Coca-Cola FEMSA, S.A.B. de C.V. reporting volume growth of 2.6% in that region for Q3 2025. This regional divergence means rivalry intensity shifts based on local economic health and specific competitor presence.
Key competitive levers Coca-Cola FEMSA, S.A.B. de C.V. is pulling include:
- Aggressive digital platform adoption, with over 60% of the total client base being digital monthly active buyers in Q3 2025.
- Focus on revenue management initiatives to counter volume softness.
- Protecting margins through expense efficiencies, including in marketing.
- Maintaining shareholder returns via a recent dividend installment of Ps. 3,865.5 million.
Coca-Cola FEMSA, S.A.B. de C.V. (KOF) - Porter's Five Forces: Threat of substitutes
You are looking at the competitive pressure from alternatives to Coca-Cola FEMSA, S.A.B. de C.V. (KOF)'s core portfolio, and honestly, this threat is quite strong right now. The main driver here is the rapid shift toward health-conscious beverages across Latin America.
Consumers are definitely looking for lower-calorie and lower-sugar options, which puts direct pressure on the traditional full-sugar offerings. To give you a sense of the baseline, low and no-sugar drinks already held about 22% of the market share back in 2023, and that trend has only accelerated. We see this reflected in the broader Latin America Carbonated Soft Drinks Market, where the standard CSD segment accounted for 58.2% of the market in 2024, but the diet CSD segment is growing with an expected Compound Annual Growth Rate (CAGR) of 7.2% during the forecast period.
The substitutes aren't just other sodas; they span a wide range of refreshment categories. These include plain water, fruit juices, functional drinks, and energy drinks, all competing for the same consumer spend. For instance, in Chile, bottled water is projected to grow 12% by 2028, and energy/sports drinks are forecast to grow by more than 20% each by 2028, albeit from a lower base.
Coca-Cola FEMSA, S.A.B. de C.V. (KOF) is actively mitigating this by aggressively pushing its low-sugar variants. The success in this area is clear. In the second quarter of 2025, Coca-Cola Zero volumes saw an impressive year-on-year increase of 56% across the company. Furthermore, the single-serve mix for low and no-sugar options reached 27.1% in Q2 2025. This shows you they are successfully converting consumers, even while facing a challenging macroeconomic backdrop in key markets like Mexico, where overall volume declined 10% in the same quarter.
Here's a quick look at how the substitute landscape is shaping up against the company's key response:
| Substitute Category | Market Context/Trend | Coca-Cola FEMSA, S.A.B. de C.V. (KOF) Mitigation Metric (Latest Available) |
| Water (Still/Sparkling) | Chile: Bottled water projected to grow 12% by 2028 | N/A (Focus on low/no-sugar CSDs) |
| Energy/Sports Drinks | Chile: Forecasted growth of more than 20% each by 2028 | N/A (Focus on low/no-sugar CSDs) |
| Low/No-Sugar CSDs (Internal Substitute) | Held 22% market share in 2023 [cite: N/A in search] | Coca-Cola Zero volumes up 56% year-on-year in Q2 2025 |
| Overall CSD Market Mix | Standard CSD segment was 58.2% of Latin America CSD Market in 2024 | Single-serve low/no-sugar mix reached 27.1% in Q2 2025 |
The pressure from non-CSD substitutes like juices and functional drinks remains a constant factor, especially as health awareness drives consumers toward less processed options. Still, the internal battle-getting consumers to trade from full-sugar to zero-sugar within the carbonated category-is where Coca-Cola FEMSA, S.A.B. de C.V. (KOF) is showing tangible, high-percentage gains.
You should watch the growth trajectory of non-cola categories, as those represent direct external substitution threats. For example, cola-flavored beverages held 47.6% of the Latin America CSD Market share in 2024.
The company's focus on simplifying pricing architecture for Coca-Cola Zero in Mexico is a direct strategic response to consumer affordability concerns, which often push buyers toward cheaper, non-branded water or other value options. Finance: review Q3 pricing elasticity models against the 10% volume decline seen in Mexico for Q2 2025.
Coca-Cola FEMSA, S.A.B. de C.V. (KOF) - Porter's Five Forces: Threat of new entrants
Threat is low due to extremely high capital investment required for bottling and distribution.
For the full fiscal year 2025, Fomento Económico Mexicano (FEMSA) allocated MX$31.6 billion to Coca-Cola FEMSA, representing 53.7% of the total planned capital expenditure of MX$58.8 billion. This investment is directed toward expanding manufacturing and distribution, acquiring returnable packaging, and technology enhancement. In the first quarter of 2025, Coca-Cola FEMSA's capital expenditures amounted to Ps. 8,788 million, marking a 16.1% increase compared to the first quarter of 2024. Over the longer term, the annual average capital expenditure has risen significantly, far exceeding the billion-dollar mark recently, up from an average of around $500 million between 2019 and 2021.
KOF's massive scale and established distribution network act as a significant barrier.
The sheer operational footprint presents a formidable hurdle for any potential entrant in the operating territories of Coca-Cola FEMSA.
| Metric | Value (as of late 2025 data) |
| Manufacturing Plants Operated | 56 |
| Distribution Centers Operated | 256 |
| Consumers Served | Over 276 million |
| Annual Unit Cases Distributed (Approximate) | 4.2 billion |
| Points of Sale Reached (Approximate) | 2.2 million |
| Share of Coca-Cola System Worldwide Volume (2024) | 12.5% |
Strong brand loyalty to the Coca-Cola system makes customer acquisition difficult for newcomers.
Coca-Cola FEMSA is recognized as the largest Coca-Cola franchise bottler in the world by sales volume. New entrants face the challenge of overcoming established consumer preference for the core portfolio, which includes brands that reach over 276 million consumers daily.
New entrants struggle to match the cost efficiencies from KOF's economies of scale.
The company's extensive network of 56 manufacturing plants and 256 distribution centers allows for significant operational leverage. This scale enables cost advantages in procurement, production, and logistics that smaller, newer operations cannot easily replicate. The substantial ongoing capital investment, such as the MX$31.6 billion planned for 2025, is aimed at further cementing these efficiencies across manufacturing and distribution infrastructure.
- Regulatory and bureaucratic complexity across multiple Latin American countries adds non-financial barriers.
- Market fragmentation and wide variations in consumer behavior across territories require tailored, expensive strategies.
- Securing reliable, cost-effective distribution channels is a key challenge for new entrants in the region.
Disclaimer
All information, articles, and product details provided on this website are for general informational and educational purposes only. We do not claim any ownership over, nor do we intend to infringe upon, any trademarks, copyrights, logos, brand names, or other intellectual property mentioned or depicted on this site. Such intellectual property remains the property of its respective owners, and any references here are made solely for identification or informational purposes, without implying any affiliation, endorsement, or partnership.
We make no representations or warranties, express or implied, regarding the accuracy, completeness, or suitability of any content or products presented. Nothing on this website should be construed as legal, tax, investment, financial, medical, or other professional advice. In addition, no part of this site—including articles or product references—constitutes a solicitation, recommendation, endorsement, advertisement, or offer to buy or sell any securities, franchises, or other financial instruments, particularly in jurisdictions where such activity would be unlawful.
All content is of a general nature and may not address the specific circumstances of any individual or entity. It is not a substitute for professional advice or services. Any actions you take based on the information provided here are strictly at your own risk. You accept full responsibility for any decisions or outcomes arising from your use of this website and agree to release us from any liability in connection with your use of, or reliance upon, the content or products found herein.