
|
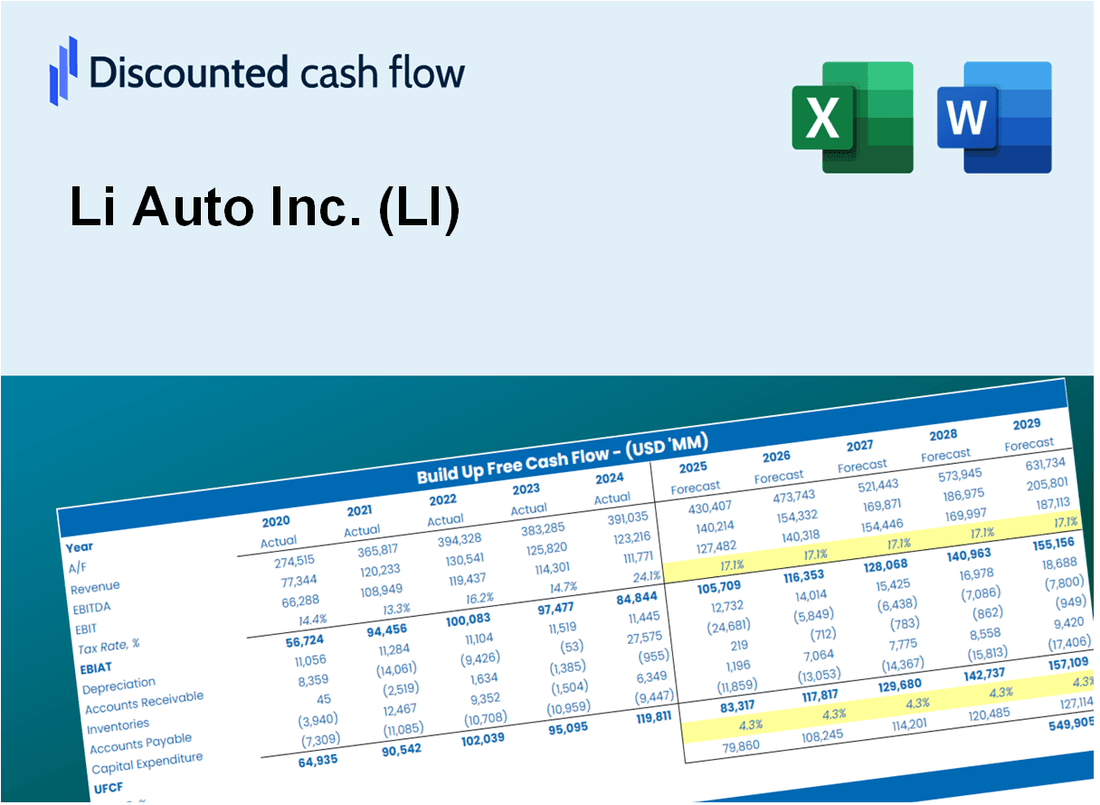
Valoración DCF de Li Auto Inc. (LI) |
Completamente Editable: Adáptelo A Sus Necesidades En Excel O Sheets
Diseño Profesional: Plantillas Confiables Y Estándares De La Industria
Predeterminadas Para Un Uso Rápido Y Eficiente
Compatible con MAC / PC, completamente desbloqueado
No Se Necesita Experiencia; Fáciles De Seguir
Li Auto Inc. (LI) Bundle
¡Mejore sus estrategias de inversión con la calculadora DCF de Li Auto Inc. (Li)! Utilice datos financieros auténticos, ajuste las proyecciones y gastos de crecimiento, y observe instantáneamente cómo estas modificaciones afectan el valor intrínseco de Li Auto Inc. (LI).
Discounted Cash Flow (DCF) - (USD MM)
| Year | AY1 2020 |
AY2 2021 |
AY3 2022 |
AY4 2023 |
AY5 2024 |
FY1 2025 |
FY2 2026 |
FY3 2027 |
FY4 2028 |
FY5 2029 |
|---|---|---|---|---|---|---|---|---|---|---|
| Revenue | 1,332.2 | 3,804.9 | 6,379.6 | 17,447.0 | 20,350.2 | 34,814.5 | 59,559.6 | 101,892.8 | 174,315.2 | 298,213.2 |
| Revenue Growth, % | 0 | 185.62 | 67.67 | 173.48 | 16.64 | 71.08 | 71.08 | 71.08 | 71.08 | 71.08 |
| EBITDA | 28.0 | 70.6 | -118.2 | 1,297.7 | 1,769.5 | 1,270.0 | 2,172.6 | 3,716.9 | 6,358.7 | 10,878.3 |
| EBITDA, % | 2.1 | 1.85 | -1.85 | 7.44 | 8.7 | 3.65 | 3.65 | 3.65 | 3.65 | 3.65 |
| Depreciation | 45.2 | 83.2 | 171.0 | 254.3 | 430.8 | 824.0 | 1,409.8 | 2,411.8 | 4,126.0 | 7,058.6 |
| Depreciation, % | 3.39 | 2.19 | 2.68 | 1.46 | 2.12 | 2.37 | 2.37 | 2.37 | 2.37 | 2.37 |
| EBIT | -17.2 | -12.6 | -289.2 | 1,043.4 | 1,338.7 | 445.9 | 762.9 | 1,305.1 | 2,232.8 | 3,819.7 |
| EBIT, % | -1.29 | -0.33161 | -4.53 | 5.98 | 6.58 | 1.28 | 1.28 | 1.28 | 1.28 | 1.28 |
| Total Cash | 4,034.5 | 6,694.5 | 7,960.5 | 14,546.6 | 15,891.0 | 32,131.3 | 54,969.2 | 94,039.7 | 160,880.3 | 275,229.2 |
| Total Cash, percent | .0 | .0 | .0 | .0 | .0 | .0 | .0 | .0 | .0 | .0 |
| Account Receivables | 16.3 | 17.0 | 6.8 | 20.2 | 19.0 | 138.2 | 236.4 | 404.4 | 691.8 | 1,183.6 |
| Account Receivables, % | 1.22 | 0.44629 | 0.10683 | 0.11588 | 0.09352904 | 0.39688 | 0.39688 | 0.39688 | 0.39688 | 0.39688 |
| Inventories | 147.6 | 227.9 | 958.6 | 968.1 | 1,153.1 | 3,015.8 | 5,159.4 | 8,826.6 | 15,100.2 | 25,833.0 |
| Inventories, % | 11.08 | 5.99 | 15.03 | 5.55 | 5.67 | 8.66 | 8.66 | 8.66 | 8.66 | 8.66 |
| Accounts Payable | 421.4 | 998.7 | 2,170.8 | 4,907.9 | 5,640.7 | 10,288.3 | 17,600.8 | 30,111.0 | 51,513.0 | 88,126.9 |
| Accounts Payable, % | 31.63 | 26.25 | 34.03 | 28.13 | 27.72 | 29.55 | 29.55 | 29.55 | 29.55 | 29.55 |
| Capital Expenditure | -95.1 | -485.2 | -722.4 | -916.7 | -1,088.9 | -2,912.0 | -4,981.7 | -8,522.5 | -14,580.1 | -24,943.2 |
| Capital Expenditure, % | -7.14 | -12.75 | -11.32 | -5.25 | -5.35 | -8.36 | -8.36 | -8.36 | -8.36 | -8.36 |
| Tax Rate, % | 13.78 | 13.78 | 13.78 | 13.78 | 13.78 | 13.78 | 13.78 | 13.78 | 13.78 | 13.78 |
| EBITAT | -13.8 | -26.5 | -269.5 | 1,168.4 | 1,154.3 | 410.0 | 701.4 | 1,199.9 | 2,052.8 | 3,511.9 |
| Depreciation | ||||||||||
| Changes in Account Receivables | ||||||||||
| Changes in Inventories | ||||||||||
| Changes in Accounts Payable | ||||||||||
| Capital Expenditure | ||||||||||
| UFCF | 193.8 | 67.7 | -369.2 | 3,220.2 | 1,045.2 | 987.7 | 2,200.3 | 3,764.2 | 6,439.6 | 11,016.7 |
| WACC, % | 5.44 | 5.57 | 5.53 | 5.57 | 5.48 | 5.52 | 5.52 | 5.52 | 5.52 | 5.52 |
| PV UFCF | ||||||||||
| SUM PV UFCF | 19,733.1 | |||||||||
| Long Term Growth Rate, % | 3.90 | |||||||||
| Free cash flow (T + 1) | 11,446 | |||||||||
| Terminal Value | 707,575 | |||||||||
| Present Terminal Value | 540,936 | |||||||||
| Enterprise Value | 560,670 | |||||||||
| Net Debt | -6,981 | |||||||||
| Equity Value | 567,651 | |||||||||
| Diluted Shares Outstanding, MM | 532 | |||||||||
| Equity Value Per Share | 1,066.37 |
What You Will Get
- Pre-Filled Financial Model: Li Auto Inc.’s actual data allows for accurate DCF valuation.
- Full Forecast Control: Modify revenue growth, margins, WACC, and other essential drivers.
- Instant Calculations: Automatic updates provide immediate results as you implement changes.
- Investor-Ready Template: A polished Excel file crafted for professional-level valuation.
- Customizable and Reusable: Designed for adaptability, enabling repeated use for comprehensive forecasts.
Key Features
- Real-Life LI Data: Pre-filled with Li Auto’s historical financials and forward-looking projections.
- Fully Customizable Inputs: Adjust revenue growth, margins, WACC, tax rates, and capital expenditures.
- Dynamic Valuation Model: Automatic updates to Net Present Value (NPV) and intrinsic value based on your inputs.
- Scenario Testing: Create multiple forecast scenarios to analyze different valuation outcomes.
- User-Friendly Design: Simple, structured, and designed for professionals and beginners alike.
How It Works
- Download: Obtain the ready-to-use Excel file featuring Li Auto Inc.'s (LI) financial data.
- Customize: Modify forecasts, including revenue growth, EBITDA %, and WACC.
- Update Automatically: The intrinsic value and NPV calculations refresh in real-time.
- Test Scenarios: Develop multiple projections and instantly compare results.
- Make Decisions: Leverage the valuation results to inform your investment strategy.
Why Choose This Calculator for Li Auto Inc. (LI)?
- User-Friendly Interface: Tailored for both novice users and seasoned professionals.
- Customizable Inputs: Adjust parameters easily to suit your financial analysis needs.
- Real-Time Valuation: Observe immediate updates to Li Auto's valuation as you change inputs.
- Preloaded Data: Comes equipped with Li Auto's latest financial information for swift evaluations.
- Preferred by Experts: Valued by investors and analysts for making well-informed decisions.
Who Should Use Li Auto Inc. (LI)?
- Investors: Gain insights and make informed investment choices with a reliable source of information on Li Auto Inc. (LI).
- Market Analysts: Streamline your research with comprehensive data and analysis on Li Auto Inc. (LI).
- Consultants: Easily customize reports or presentations focused on Li Auto Inc. (LI) for your clients.
- Automotive Enthusiasts: Explore the latest trends and developments in the electric vehicle market through the lens of Li Auto Inc. (LI).
- Students and Educators: Utilize resources related to Li Auto Inc. (LI) for practical applications in business and finance education.
What the Template Contains
- Pre-Filled Data: Includes Li Auto Inc.'s (LI) historical financials and projections.
- Discounted Cash Flow Model: Editable DCF valuation model with automated calculations.
- Weighted Average Cost of Capital (WACC): A dedicated sheet for calculating WACC based on user-defined inputs.
- Key Financial Ratios: Evaluate Li Auto Inc.'s (LI) profitability, efficiency, and leverage.
- Customizable Inputs: Easily adjust revenue growth, margins, and tax rates.
- Clear Dashboard: Visuals and tables summarizing essential valuation outcomes.
Disclaimer
All information, articles, and product details provided on this website are for general informational and educational purposes only. We do not claim any ownership over, nor do we intend to infringe upon, any trademarks, copyrights, logos, brand names, or other intellectual property mentioned or depicted on this site. Such intellectual property remains the property of its respective owners, and any references here are made solely for identification or informational purposes, without implying any affiliation, endorsement, or partnership.
We make no representations or warranties, express or implied, regarding the accuracy, completeness, or suitability of any content or products presented. Nothing on this website should be construed as legal, tax, investment, financial, medical, or other professional advice. In addition, no part of this site—including articles or product references—constitutes a solicitation, recommendation, endorsement, advertisement, or offer to buy or sell any securities, franchises, or other financial instruments, particularly in jurisdictions where such activity would be unlawful.
All content is of a general nature and may not address the specific circumstances of any individual or entity. It is not a substitute for professional advice or services. Any actions you take based on the information provided here are strictly at your own risk. You accept full responsibility for any decisions or outcomes arising from your use of this website and agree to release us from any liability in connection with your use of, or reliance upon, the content or products found herein.