
|
Valoración DCF del Grupo Bancario Lloyds plc (LYG) |
Completamente Editable: Adáptelo A Sus Necesidades En Excel O Sheets
Diseño Profesional: Plantillas Confiables Y Estándares De La Industria
Predeterminadas Para Un Uso Rápido Y Eficiente
Compatible con MAC / PC, completamente desbloqueado
No Se Necesita Experiencia; Fáciles De Seguir
Lloyds Banking Group plc (LYG) Bundle
Ingementista para su precisión, nuestra calculadora DCF (LYG) le permite evaluar la valoración del PLC del grupo bancario Lloyds utilizando datos financieros auténticos, que ofrece una flexibilidad completa para modificar todos los parámetros esenciales para pronósticos mejorados.
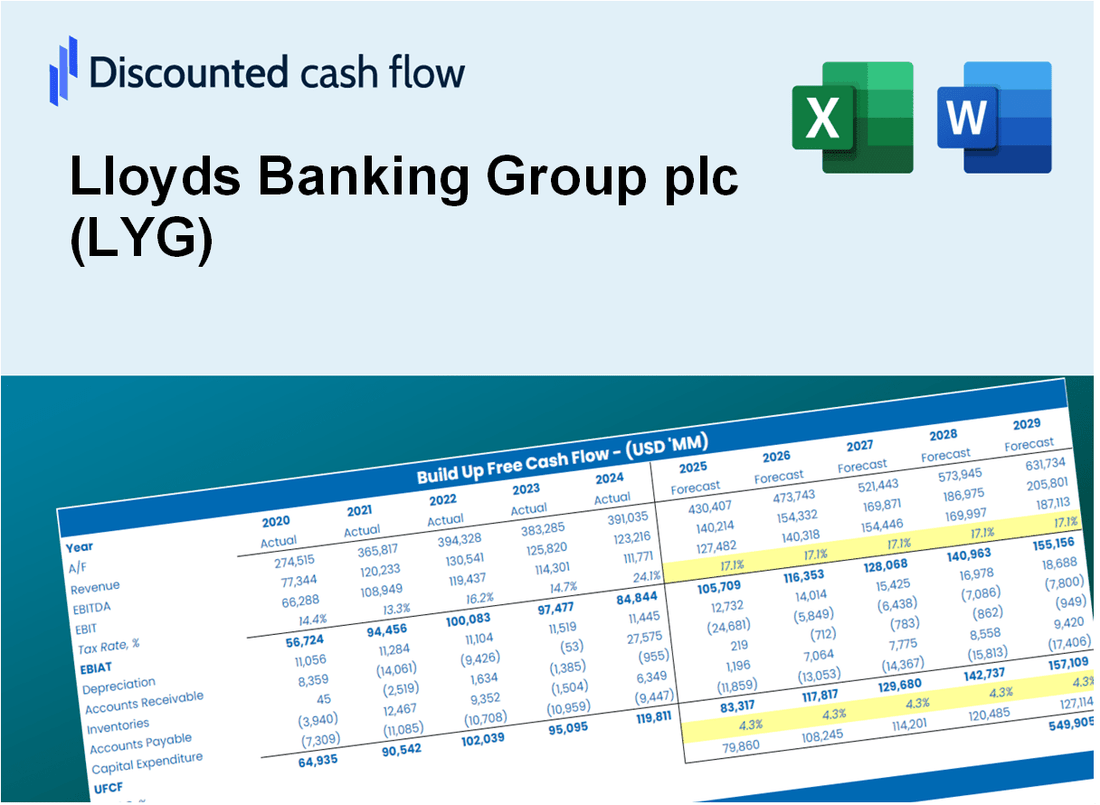
Discounted Cash Flow (DCF) - (USD MM)
| Year | AY1 2020 |
AY2 2021 |
AY3 2022 |
AY4 2023 |
AY5 2024 |
FY1 2025 |
FY2 2026 |
FY3 2027 |
FY4 2028 |
FY5 2029 |
|---|---|---|---|---|---|---|---|---|---|---|
| Revenue | 24,614.5 | 22,556.0 | 19,135.8 | 24,249.6 | 49,537.1 | 62,317.4 | 78,395.0 | 98,620.5 | 124,064.1 | 156,072.1 |
| Revenue Growth, % | 0 | -8.36 | -15.16 | 26.72 | 104.28 | 25.8 | 25.8 | 25.8 | 25.8 | 25.8 |
| EBITDA | 5,212.6 | 12,807.7 | 9,440.1 | 13,707.2 | 12,375.7 | 26,023.7 | 32,737.6 | 41,183.8 | 51,809.0 | 65,175.5 |
| EBITDA, % | 21.18 | 56.78 | 49.33 | 56.53 | 24.98 | 41.76 | 41.76 | 41.76 | 41.76 | 41.76 |
| Depreciation | 3,598.0 | 3,720.5 | 3,155.5 | 3,825.8 | 4,512.0 | 9,034.4 | 11,365.3 | 14,297.4 | 17,986.1 | 22,626.4 |
| Depreciation, % | 14.62 | 16.49 | 16.49 | 15.78 | 9.11 | 14.5 | 14.5 | 14.5 | 14.5 | 14.5 |
| EBIT | 1,614.6 | 9,087.2 | 6,284.7 | 9,881.3 | 7,863.7 | 16,989.2 | 21,372.4 | 26,886.3 | 33,822.9 | 42,549.0 |
| EBIT, % | 6.56 | 40.29 | 32.84 | 40.75 | 15.87 | 27.26 | 27.26 | 27.26 | 27.26 | 27.26 |
| Total Cash | 96,872.2 | 100,837.6 | 120,675.3 | 104,070.8 | 82,551.3 | 62,317.4 | 78,395.0 | 98,620.5 | 124,064.1 | 156,072.1 |
| Total Cash, percent | .0 | .0 | .0 | .0 | .0 | .0 | .0 | .0 | .0 | .0 |
| Account Receivables | .0 | .0 | .0 | .0 | .0 | .0 | .0 | .0 | .0 | .0 |
| Account Receivables, % | 0 | 0 | 0 | 0 | 0 | 0 | 0 | 0 | 0 | 0 |
| Inventories | .0 | .0 | .0 | .0 | .0 | .0 | .0 | .0 | .0 | .0 |
| Inventories, % | 0 | 0 | 0 | 0 | 0 | 0 | 0 | 0 | 0 | 0 |
| Accounts Payable | .0 | 1,128.7 | .0 | .0 | .0 | 623.6 | 784.5 | 987.0 | 1,241.6 | 1,561.9 |
| Accounts Payable, % | 0 | 5 | 0 | 0 | 0 | 1 | 1 | 1 | 1 | 1 |
| Capital Expenditure | -3,820.6 | -4,251.2 | -5,077.0 | -7,184.2 | -5,747.3 | -12,728.7 | -16,012.7 | -20,143.9 | -25,340.9 | -31,878.8 |
| Capital Expenditure, % | -15.52 | -18.85 | -26.53 | -29.63 | -11.6 | -20.43 | -20.43 | -20.43 | -20.43 | -20.43 |
| Tax Rate, % | 25.96 | 25.96 | 25.96 | 25.96 | 25.96 | 25.96 | 25.96 | 25.96 | 25.96 | 25.96 |
| EBITAT | 1,735.8 | 7,615.2 | 5,029.6 | 7,190.7 | 5,822.4 | 13,953.0 | 17,552.8 | 22,081.4 | 27,778.3 | 34,944.9 |
| Depreciation | ||||||||||
| Changes in Account Receivables | ||||||||||
| Changes in Inventories | ||||||||||
| Changes in Accounts Payable | ||||||||||
| Capital Expenditure | ||||||||||
| UFCF | 1,513.2 | 8,213.1 | 1,979.4 | 3,832.4 | 4,587.1 | 10,882.3 | 13,066.3 | 16,437.3 | 20,678.1 | 26,012.9 |
| WACC, % | 21.21 | 17.98 | 17.23 | 15.78 | 16.03 | 17.65 | 17.65 | 17.65 | 17.65 | 17.65 |
| PV UFCF | ||||||||||
| SUM PV UFCF | 51,122.1 | |||||||||
| Long Term Growth Rate, % | 2.00 | |||||||||
| Free cash flow (T + 1) | 26,533 | |||||||||
| Terminal Value | 169,581 | |||||||||
| Present Terminal Value | 75,246 | |||||||||
| Enterprise Value | 126,369 | |||||||||
| Net Debt | 24,023 | |||||||||
| Equity Value | 102,345 | |||||||||
| Diluted Shares Outstanding, MM | 3,942 | |||||||||
| Equity Value Per Share | 25.96 |
What You Will Receive
- Comprehensive Financial Model: Utilize Lloyds Banking Group plc's (LYG) actual data for accurate DCF valuation.
- Complete Forecasting Control: Modify revenue growth, profit margins, WACC, and other essential parameters.
- Real-Time Calculations: Automatic updates provide immediate results as adjustments are made.
- Professional-Grade Template: A polished Excel file crafted for expert-level valuation.
- Adaptable and Reusable: Designed for versatility, allowing repeated application for in-depth forecasts.
Key Features
- Comprehensive LYG Data: Pre-filled with Lloyds Banking Group’s historical financials and future projections.
- Customizable Financial Inputs: Modify parameters such as loan growth, interest margins, risk-adjusted discount rates, tax rates, and capital investments.
- Interactive Valuation Model: Automatic recalculations of Net Present Value (NPV) and intrinsic value based on your adjustments.
- Scenario Analysis: Develop various forecast scenarios to evaluate different valuation results.
- User-Centric Interface: Intuitive, organized, and tailored for both industry professionals and newcomers.
How It Functions
- Download the Template: Gain immediate access to the Excel-based LYG DCF Calculator.
- Input Your Assumptions: Modify the yellow-highlighted cells for growth rates, WACC, margins, and other variables.
- Instant Calculations: The model automatically recalculates Lloyds Banking Group’s intrinsic value.
- Test Scenarios: Experiment with various assumptions to assess potential changes in valuation.
- Analyze and Decide: Utilize the outcomes to inform your investment or financial analysis.
Why Choose This Calculator?
- Accuracy: Utilizes genuine Lloyds Banking Group financials to ensure data precision.
- Flexibility: Built to allow users to easily test and adjust inputs as needed.
- Time-Saving: Eliminate the complexity of creating a DCF model from the ground up.
- Professional-Grade: Crafted with the expertise and usability expected at the CFO level.
- User-Friendly: Intuitive design makes it accessible for users with no advanced financial modeling background.
Who Should Use This Product?
- Individual Investors: Make informed decisions about buying or selling Lloyds Banking Group plc (LYG) stock.
- Financial Analysts: Streamline valuation processes with ready-to-use financial models for Lloyds Banking Group plc (LYG).
- Consultants: Deliver professional valuation insights for Lloyds Banking Group plc (LYG) to clients quickly and accurately.
- Business Owners: Understand how large companies like Lloyds Banking Group plc (LYG) are valued to guide your own strategy.
- Finance Students: Learn valuation techniques using real-world data and scenarios related to Lloyds Banking Group plc (LYG).
What the Template Contains
- Historical Data: Includes Lloyds Banking Group plc’s past financials and baseline forecasts.
- DCF and Levered DCF Models: Detailed templates to calculate Lloyds Banking Group plc’s intrinsic value.
- WACC Sheet: Pre-built calculations for Weighted Average Cost of Capital.
- Editable Inputs: Modify key drivers like growth rates, EBITDA %, and CAPEX assumptions.
- Quarterly and Annual Statements: A complete breakdown of Lloyds Banking Group plc’s financials.
- Interactive Dashboard: Visualize valuation results and projections dynamically.
Disclaimer
All information, articles, and product details provided on this website are for general informational and educational purposes only. We do not claim any ownership over, nor do we intend to infringe upon, any trademarks, copyrights, logos, brand names, or other intellectual property mentioned or depicted on this site. Such intellectual property remains the property of its respective owners, and any references here are made solely for identification or informational purposes, without implying any affiliation, endorsement, or partnership.
We make no representations or warranties, express or implied, regarding the accuracy, completeness, or suitability of any content or products presented. Nothing on this website should be construed as legal, tax, investment, financial, medical, or other professional advice. In addition, no part of this site—including articles or product references—constitutes a solicitation, recommendation, endorsement, advertisement, or offer to buy or sell any securities, franchises, or other financial instruments, particularly in jurisdictions where such activity would be unlawful.
All content is of a general nature and may not address the specific circumstances of any individual or entity. It is not a substitute for professional advice or services. Any actions you take based on the information provided here are strictly at your own risk. You accept full responsibility for any decisions or outcomes arising from your use of this website and agree to release us from any liability in connection with your use of, or reliance upon, the content or products found herein.