
|
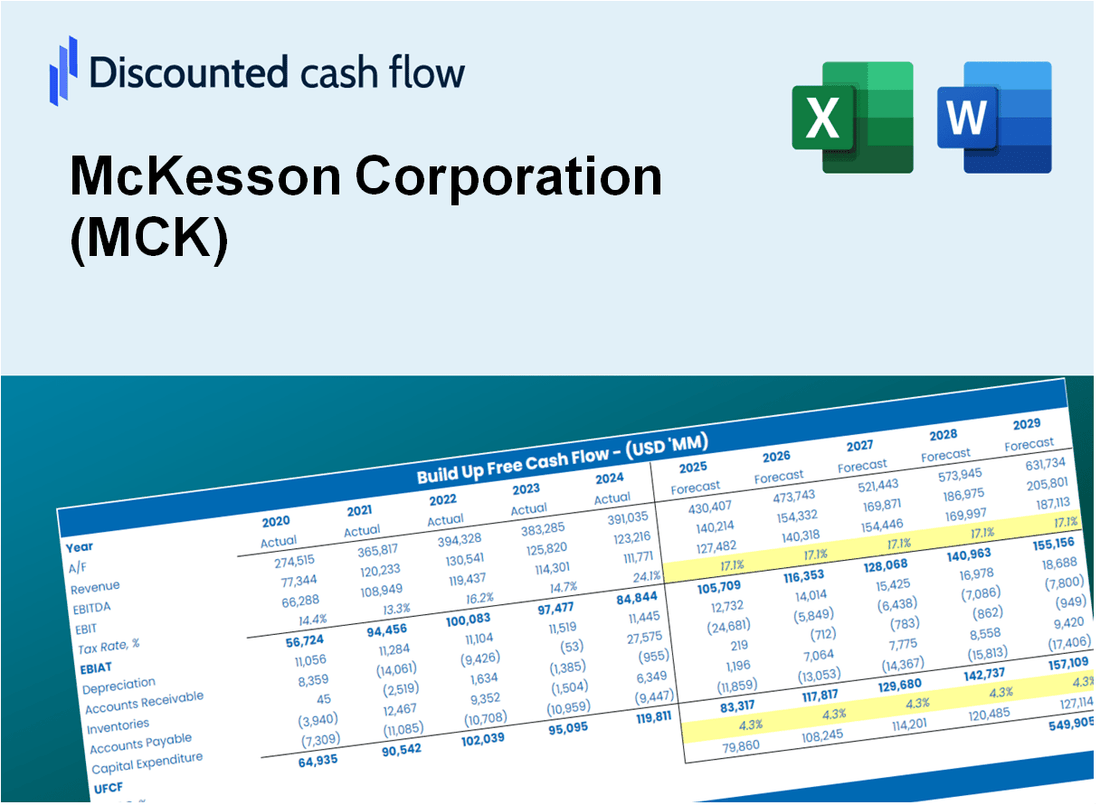
Valoración DCF de McKesson Corporation (MCK) |
Completamente Editable: Adáptelo A Sus Necesidades En Excel O Sheets
Diseño Profesional: Plantillas Confiables Y Estándares De La Industria
Predeterminadas Para Un Uso Rápido Y Eficiente
Compatible con MAC / PC, completamente desbloqueado
No Se Necesita Experiencia; Fáciles De Seguir
McKesson Corporation (MCK) Bundle
¡Obtenga dominio sobre su análisis de valoración de McKesson Corporation (MCK) utilizando nuestra sofisticada calculadora DCF! Esta plantilla de Excel viene precargada con datos reales (MCK), lo que le permite ajustar los pronósticos y los supuestos para determinar con precisión el valor intrínseco de McKesson Corporation.
Discounted Cash Flow (DCF) - (USD MM)
| Year | AY1 2021 |
AY2 2022 |
AY3 2023 |
AY4 2024 |
AY5 2025 |
FY1 2026 |
FY2 2027 |
FY3 2028 |
FY4 2029 |
FY5 2030 |
|---|---|---|---|---|---|---|---|---|---|---|
| Revenue | 238,228.0 | 263,966.0 | 276,711.0 | 308,951.0 | 359,051.0 | 398,097.4 | 441,390.0 | 489,390.6 | 542,611.2 | 601,619.6 |
| Revenue Growth, % | 0 | 10.8 | 4.83 | 11.65 | 16.22 | 10.87 | 10.87 | 10.87 | 10.87 | 10.87 |
| EBITDA | -3,596.0 | 3,107.0 | 5,735.0 | 4,667.0 | 5,251.0 | 3,752.6 | 4,160.7 | 4,613.2 | 5,114.9 | 5,671.1 |
| EBITDA, % | -1.51 | 1.18 | 2.07 | 1.51 | 1.46 | 0.94264 | 0.94264 | 0.94264 | 0.94264 | 0.94264 |
| Depreciation | 1,221.0 | 1,001.0 | 857.0 | 635.0 | 636.0 | 1,261.3 | 1,398.4 | 1,550.5 | 1,719.1 | 1,906.1 |
| Depreciation, % | 0.51253 | 0.37922 | 0.30971 | 0.20553 | 0.17713 | 0.31683 | 0.31683 | 0.31683 | 0.31683 | 0.31683 |
| EBIT | -4,817.0 | 2,106.0 | 4,878.0 | 4,032.0 | 4,615.0 | 2,491.3 | 2,762.3 | 3,062.7 | 3,395.7 | 3,765.0 |
| EBIT, % | -2.02 | 0.79783 | 1.76 | 1.31 | 1.29 | 0.62581 | 0.62581 | 0.62581 | 0.62581 | 0.62581 |
| Total Cash | 6,278.0 | 3,532.0 | 4,678.0 | 4,583.0 | 5,691.0 | 6,952.6 | 7,708.7 | 8,547.0 | 9,476.5 | 10,507.1 |
| Total Cash, percent | .0 | .0 | .0 | .0 | .0 | .0 | .0 | .0 | .0 | .0 |
| Account Receivables | 19,181.0 | 18,583.0 | 19,410.0 | 21,622.0 | 25,643.0 | 28,859.2 | 31,997.6 | 35,477.3 | 39,335.4 | 43,613.1 |
| Account Receivables, % | 8.05 | 7.04 | 7.01 | 7 | 7.14 | 7.25 | 7.25 | 7.25 | 7.25 | 7.25 |
| Inventories | 19,246.0 | 18,702.0 | 19,691.0 | 21,139.0 | 23,001.0 | 28,287.3 | 31,363.5 | 34,774.3 | 38,555.9 | 42,748.9 |
| Inventories, % | 8.08 | 7.09 | 7.12 | 6.84 | 6.41 | 7.11 | 7.11 | 7.11 | 7.11 | 7.11 |
| Accounts Payable | 38,975.0 | 38,086.0 | 42,490.0 | 47,097.0 | 55,330.0 | 61,146.4 | 67,796.0 | 75,168.8 | 83,343.3 | 92,406.8 |
| Accounts Payable, % | 16.36 | 14.43 | 15.36 | 15.24 | 15.41 | 15.36 | 15.36 | 15.36 | 15.36 | 15.36 |
| Capital Expenditure | -641.0 | -535.0 | -558.0 | -687.0 | -859.0 | -903.7 | -1,002.0 | -1,110.9 | -1,231.7 | -1,365.7 |
| Capital Expenditure, % | -0.26907 | -0.20268 | -0.20165 | -0.22237 | -0.23924 | -0.227 | -0.227 | -0.227 | -0.227 | -0.227 |
| Tax Rate, % | 24.41 | 24.41 | 24.41 | 24.41 | 24.41 | 24.41 | 24.41 | 24.41 | 24.41 | 24.41 |
| EBITAT | -4,343.3 | 1,216.8 | 3,750.7 | 3,194.5 | 3,488.5 | 1,891.7 | 2,097.4 | 2,325.5 | 2,578.4 | 2,858.8 |
| Depreciation | ||||||||||
| Changes in Account Receivables | ||||||||||
| Changes in Inventories | ||||||||||
| Changes in Accounts Payable | ||||||||||
| Capital Expenditure | ||||||||||
| UFCF | -3,215.3 | 1,935.8 | 6,637.7 | 4,089.5 | 5,615.5 | -436.8 | 2,928.9 | 3,247.4 | 3,600.6 | 3,992.1 |
| WACC, % | 5.88 | 5.79 | 5.84 | 5.85 | 5.84 | 5.84 | 5.84 | 5.84 | 5.84 | 5.84 |
| PV UFCF | ||||||||||
| SUM PV UFCF | 10,815.8 | |||||||||
| Long Term Growth Rate, % | 1.00 | |||||||||
| Free cash flow (T + 1) | 4,032 | |||||||||
| Terminal Value | 83,302 | |||||||||
| Present Terminal Value | 62,719 | |||||||||
| Enterprise Value | 73,535 | |||||||||
| Net Debt | 1,699 | |||||||||
| Equity Value | 71,836 | |||||||||
| Diluted Shares Outstanding, MM | 128 | |||||||||
| Equity Value Per Share | 560.78 |
What You Will Get
- Editable Excel Template: A fully customizable Excel-based DCF Calculator featuring pre-filled real MCK financials.
- Real-World Data: Historical data and forward-looking estimates (as indicated in the yellow cells).
- Forecast Flexibility: Modify forecast assumptions such as revenue growth, EBITDA %, and WACC.
- Automatic Calculations: Quickly observe the effects of your inputs on McKesson’s valuation.
- Professional Tool: Designed for investors, CFOs, consultants, and financial analysts.
- User-Friendly Design: Organized for clarity and ease of use, complete with step-by-step instructions.
Key Features
- Comprehensive McKesson Financials: Gain access to precise pre-loaded historical data and future forecasts.
- Adjustable Forecast Parameters: Modify highlighted cells such as WACC, growth rates, and profit margins.
- Real-Time Calculations: Instant updates to DCF, Net Present Value (NPV), and cash flow assessments.
- Interactive Dashboard: User-friendly charts and summaries to illustrate your valuation findings.
- Suitable for All Levels: A straightforward, intuitive design tailored for investors, CFOs, and consultants.
How It Works
- Step 1: Download the prebuilt Excel template featuring McKesson Corporation’s (MCK) data.
- Step 2: Navigate through the pre-filled sheets to familiarize yourself with the essential metrics.
- Step 3: Adjust forecasts and assumptions in the customizable yellow cells (WACC, growth, margins).
- Step 4: Instantly see recalculated results, including McKesson Corporation’s (MCK) intrinsic value.
- Step 5: Make well-informed investment choices or create reports based on the outputs.
Why Choose This Calculator for McKesson Corporation (MCK)?
- User-Friendly Interface: Tailored for both novice users and seasoned professionals.
- Customizable Inputs: Adjust parameters easily to suit your specific analysis needs.
- Real-Time Valuation: Monitor immediate changes to McKesson's valuation as you tweak inputs.
- Preloaded Data: Comes with McKesson’s actual financial metrics for swift evaluations.
- Relied Upon by Experts: Favored by investors and analysts for making well-informed choices.
Who Should Use This Product?
- Investors: Accurately assess McKesson’s fair value before making investment choices.
- CFOs: Utilize a professional-grade DCF model for financial reporting and analysis specific to McKesson (MCK).
- Consultants: Efficiently modify the template for valuation reports tailored to McKesson (MCK) clients.
- Entrepreneurs: Discover financial modeling strategies employed by leading healthcare companies like McKesson (MCK).
- Educators: Implement it as a teaching resource to illustrate valuation techniques relevant to McKesson (MCK).
What the Template Contains
- Pre-Filled Data: Contains McKesson Corporation’s historical financials and projections.
- Discounted Cash Flow Model: Editable DCF valuation model with automated calculations.
- Weighted Average Cost of Capital (WACC): A dedicated sheet for computing WACC based on user-defined inputs.
- Key Financial Ratios: Evaluate McKesson’s profitability, efficiency, and financial leverage.
- Customizable Inputs: Easily modify revenue growth, profit margins, and tax rates.
- Clear Dashboard: Visual representations and tables summarizing essential valuation outcomes.
Disclaimer
All information, articles, and product details provided on this website are for general informational and educational purposes only. We do not claim any ownership over, nor do we intend to infringe upon, any trademarks, copyrights, logos, brand names, or other intellectual property mentioned or depicted on this site. Such intellectual property remains the property of its respective owners, and any references here are made solely for identification or informational purposes, without implying any affiliation, endorsement, or partnership.
We make no representations or warranties, express or implied, regarding the accuracy, completeness, or suitability of any content or products presented. Nothing on this website should be construed as legal, tax, investment, financial, medical, or other professional advice. In addition, no part of this site—including articles or product references—constitutes a solicitation, recommendation, endorsement, advertisement, or offer to buy or sell any securities, franchises, or other financial instruments, particularly in jurisdictions where such activity would be unlawful.
All content is of a general nature and may not address the specific circumstances of any individual or entity. It is not a substitute for professional advice or services. Any actions you take based on the information provided here are strictly at your own risk. You accept full responsibility for any decisions or outcomes arising from your use of this website and agree to release us from any liability in connection with your use of, or reliance upon, the content or products found herein.