
|
Valoración DCF de Oatly Group AB (OTLY) |
Completamente Editable: Adáptelo A Sus Necesidades En Excel O Sheets
Diseño Profesional: Plantillas Confiables Y Estándares De La Industria
Predeterminadas Para Un Uso Rápido Y Eficiente
Compatible con MAC / PC, completamente desbloqueado
No Se Necesita Experiencia; Fáciles De Seguir
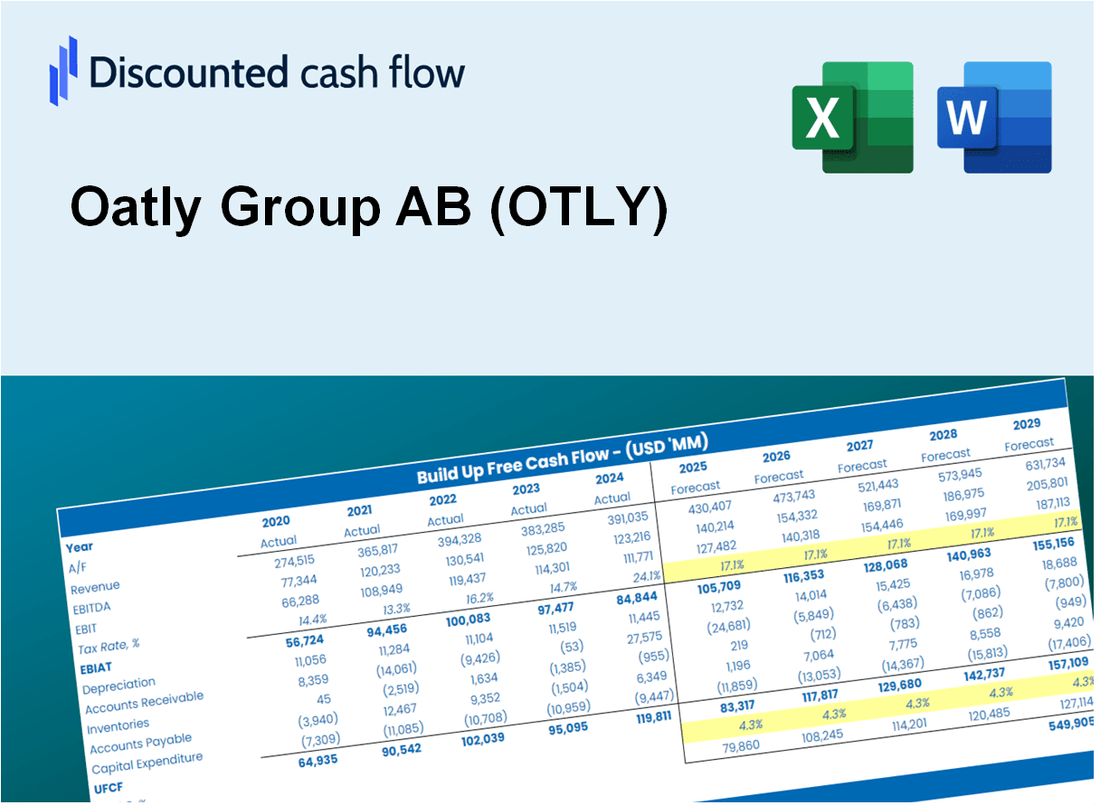
Oatly Group AB (OTLY) Bundle
¡Optimice su tiempo y aumente la precisión con nuestra calculadora DCF (otly)! Utilizando datos reales de Oatly Group AB y suposiciones personalizables, esta herramienta le permite pronosticar, analizar y evaluar (otly) como un inversor experto.
Discounted Cash Flow (DCF) - (USD MM)
| Year | AY1 2020 |
AY2 2021 |
AY3 2022 |
AY4 2023 |
AY5 2024 |
FY1 2025 |
FY2 2026 |
FY3 2027 |
FY4 2028 |
FY5 2029 |
|---|---|---|---|---|---|---|---|---|---|---|
| Revenue | 421.4 | 643.2 | 722.2 | 783.3 | 823.7 | 985.4 | 1,178.9 | 1,410.4 | 1,687.4 | 2,018.7 |
| Revenue Growth, % | 0 | 52.65 | 12.29 | 8.46 | 5.15 | 19.64 | 19.64 | 19.64 | 19.64 | 19.64 |
| EBITDA | -33.0 | -172.1 | -335.2 | -287.8 | -86.1 | -252.6 | -302.2 | -361.6 | -432.6 | -517.5 |
| EBITDA, % | -7.82 | -26.77 | -46.4 | -36.74 | -10.46 | -25.64 | -25.64 | -25.64 | -25.64 | -25.64 |
| Depreciation | 13.1 | 27.2 | 48.3 | 52.0 | 50.0 | 52.7 | 63.0 | 75.4 | 90.2 | 107.9 |
| Depreciation, % | 3.11 | 4.23 | 6.69 | 6.63 | 6.07 | 5.35 | 5.35 | 5.35 | 5.35 | 5.35 |
| EBIT | -46.1 | -199.4 | -383.5 | -339.8 | -136.1 | -305.3 | -365.3 | -437.0 | -522.8 | -625.5 |
| EBIT, % | -10.94 | -31 | -53.09 | -43.37 | -16.52 | -30.98 | -30.98 | -30.98 | -30.98 | -30.98 |
| Total Cash | 105.4 | 545.5 | 82.6 | 249.3 | 98.9 | 325.4 | 389.3 | 465.7 | 557.2 | 666.6 |
| Total Cash, percent | .0 | .0 | .0 | .0 | .0 | .0 | .0 | .0 | .0 | .0 |
| Account Receivables | 71.3 | 134.3 | 115.9 | 147.5 | 124.0 | 172.9 | 206.9 | 247.5 | 296.1 | 354.2 |
| Account Receivables, % | 16.92 | 20.88 | 16.05 | 18.83 | 15.06 | 17.55 | 17.55 | 17.55 | 17.55 | 17.55 |
| Inventories | 39.1 | 95.7 | 114.5 | 67.9 | 65.6 | 111.6 | 133.5 | 159.8 | 191.1 | 228.7 |
| Inventories, % | 9.28 | 14.87 | 15.85 | 8.67 | 7.96 | 11.33 | 11.33 | 11.33 | 11.33 | 11.33 |
| Accounts Payable | 45.3 | 93.0 | 82.5 | 64.4 | 60.2 | 102.8 | 123.0 | 147.1 | 176.0 | 210.6 |
| Accounts Payable, % | 10.75 | 14.47 | 11.43 | 8.22 | 7.3 | 10.43 | 10.43 | 10.43 | 10.43 | 10.43 |
| Capital Expenditure | -141.7 | -281.6 | -206.2 | -69.0 | -41.2 | -236.1 | -282.4 | -337.9 | -404.2 | -483.6 |
| Capital Expenditure, % | -33.64 | -43.78 | -28.55 | -8.81 | -5 | -23.96 | -23.96 | -23.96 | -23.96 | -23.96 |
| Tax Rate, % | -1.7 | -1.7 | -1.7 | -1.7 | -1.7 | -1.7 | -1.7 | -1.7 | -1.7 | -1.7 |
| EBITAT | -48.0 | -196.9 | -378.8 | -347.0 | -138.4 | -303.8 | -363.5 | -434.9 | -520.3 | -622.4 |
| Depreciation | ||||||||||
| Changes in Account Receivables | ||||||||||
| Changes in Inventories | ||||||||||
| Changes in Accounts Payable | ||||||||||
| Capital Expenditure | ||||||||||
| UFCF | -241.7 | -523.1 | -547.7 | -367.2 | -108.1 | -539.4 | -618.6 | -740.0 | -885.3 | -1,059.2 |
| WACC, % | 13.47 | 13.38 | 13.38 | 13.47 | 13.47 | 13.43 | 13.43 | 13.43 | 13.43 | 13.43 |
| PV UFCF | ||||||||||
| SUM PV UFCF | -2,562.0 | |||||||||
| Long Term Growth Rate, % | 2.00 | |||||||||
| Free cash flow (T + 1) | -1,080 | |||||||||
| Terminal Value | -9,449 | |||||||||
| Present Terminal Value | -5,031 | |||||||||
| Enterprise Value | -7,593 | |||||||||
| Net Debt | 393 | |||||||||
| Equity Value | -7,985 | |||||||||
| Diluted Shares Outstanding, MM | 30 | |||||||||
| Equity Value Per Share | -267.57 |
What You Will Get
- Genuine Oatly Data: Preloaded financials – encompassing revenue to EBIT – derived from actual and projected figures.
- Complete Customization: Modify all essential parameters (yellow cells) such as WACC, growth %, and tax rates.
- Instant Valuation Updates: Automatic recalculations to evaluate the impact of changes on Oatly’s fair value.
- Flexible Excel Template: Designed for quick edits, scenario analysis, and detailed forecasting.
- Time-Efficient and Precise: Avoid the hassle of building models from scratch while ensuring accuracy and adaptability.
Key Features
- Comprehensive Historical Data: Oatly Group AB’s financial statements and pre-filled projections.
- Customizable Parameters: Adjust WACC, tax rates, revenue growth, and EBITDA margins as needed.
- Real-Time Valuation: Instantly view Oatly’s intrinsic value as it updates live.
- Intuitive Visualizations: Dashboard graphs illustrate valuation outcomes and essential metrics.
- Designed for Precision: A reliable tool for analysts, investors, and finance professionals.
How It Works
- 1. Access the Template: Download and open the Excel file containing Oatly Group AB’s (OTLY) preloaded data.
- 2. Modify Assumptions: Adjust key parameters such as growth projections, WACC, and capital expenditures.
- 3. Instant Results: The DCF model automatically computes intrinsic value and NPV based on your inputs.
- 4. Explore Scenarios: Evaluate various forecasts to understand different valuation possibilities.
- 5. Present with Assurance: Share professional valuation insights to back up your strategic decisions.
Why Choose This Calculator for Oatly Group AB (OTLY)?
- All-in-One Solution: Combines DCF, WACC, and financial ratio analyses tailored for Oatly.
- Flexible Inputs: Modify yellow-highlighted fields to explore different financial scenarios.
- In-Depth Analysis: Automatically computes Oatly’s intrinsic value and Net Present Value.
- Preloaded Information: Access to historical and projected data for reliable analysis.
- High-Quality Standards: Perfect for financial analysts, investors, and business advisors focused on Oatly.
Who Should Use This Product?
- Individual Investors: Make informed decisions about buying or selling Oatly Group AB (OTLY) stock.
- Financial Analysts: Streamline valuation processes with ready-to-use financial models specific to Oatly Group AB (OTLY).
- Consultants: Deliver professional valuation insights on Oatly Group AB (OTLY) to clients quickly and accurately.
- Business Owners: Understand how companies like Oatly Group AB (OTLY) are valued to guide your own strategy.
- Finance Students: Learn valuation techniques using real-world data and scenarios related to Oatly Group AB (OTLY).
What the Template Contains
- Pre-Filled DCF Model: Oatly’s financial data preloaded for immediate use.
- WACC Calculator: Detailed calculations for Weighted Average Cost of Capital.
- Financial Ratios: Evaluate Oatly’s profitability, leverage, and efficiency.
- Editable Inputs: Change assumptions such as growth, margins, and CAPEX to fit your scenarios.
- Financial Statements: Annual and quarterly reports to support detailed analysis.
- Interactive Dashboard: Easily visualize key valuation metrics and results.
Disclaimer
All information, articles, and product details provided on this website are for general informational and educational purposes only. We do not claim any ownership over, nor do we intend to infringe upon, any trademarks, copyrights, logos, brand names, or other intellectual property mentioned or depicted on this site. Such intellectual property remains the property of its respective owners, and any references here are made solely for identification or informational purposes, without implying any affiliation, endorsement, or partnership.
We make no representations or warranties, express or implied, regarding the accuracy, completeness, or suitability of any content or products presented. Nothing on this website should be construed as legal, tax, investment, financial, medical, or other professional advice. In addition, no part of this site—including articles or product references—constitutes a solicitation, recommendation, endorsement, advertisement, or offer to buy or sell any securities, franchises, or other financial instruments, particularly in jurisdictions where such activity would be unlawful.
All content is of a general nature and may not address the specific circumstances of any individual or entity. It is not a substitute for professional advice or services. Any actions you take based on the information provided here are strictly at your own risk. You accept full responsibility for any decisions or outcomes arising from your use of this website and agree to release us from any liability in connection with your use of, or reliance upon, the content or products found herein.