
|
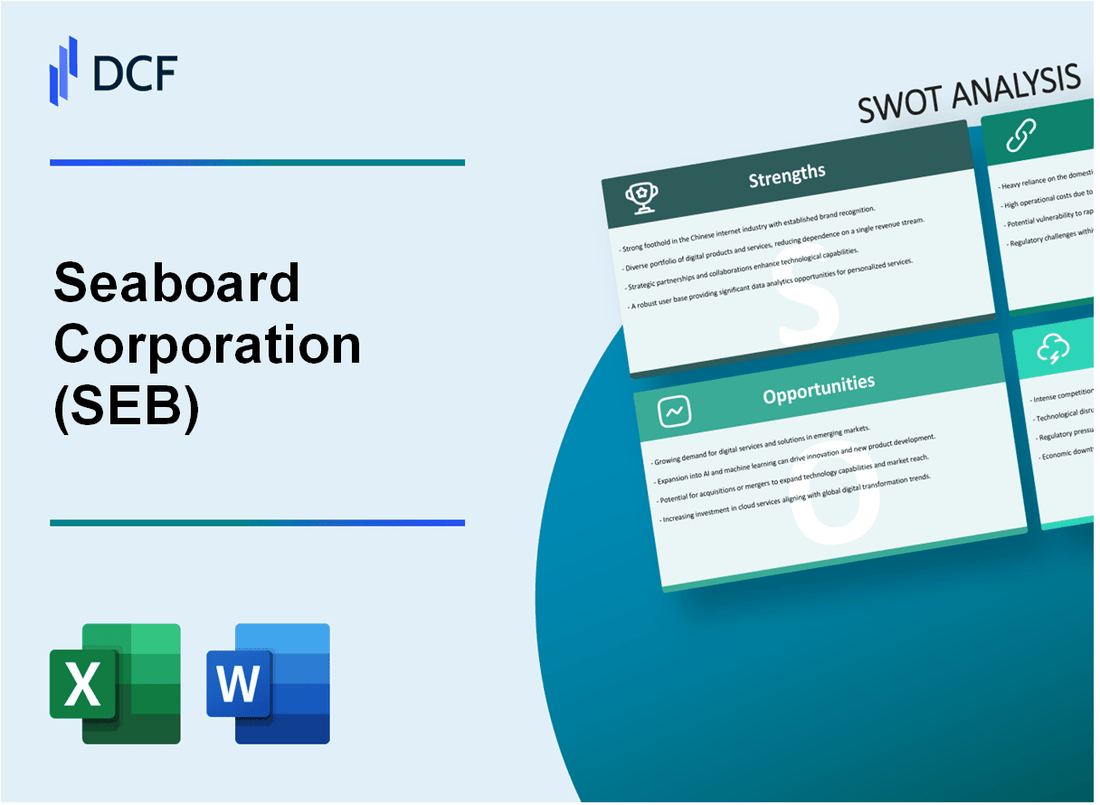
Seaboard Corporation (SEB): Análisis FODA [Actualizado en Ene-2025] |
Completamente Editable: Adáptelo A Sus Necesidades En Excel O Sheets
Diseño Profesional: Plantillas Confiables Y Estándares De La Industria
Predeterminadas Para Un Uso Rápido Y Eficiente
Compatible con MAC / PC, completamente desbloqueado
No Se Necesita Experiencia; Fáciles De Seguir
Seaboard Corporation (SEB) Bundle
En el panorama dinámico de la agricultura global y el comercio de productos básicos, Seaboard Corporation (SEB) surge como una potencia estratégica, navegando por complejos mercados internacionales con un enfoque comercial multifacético. Este análisis FODA completo revela el intrincado equilibrio de fortalezas, debilidades, oportunidades y amenazas de la compañía, ofreciendo información sobre cómo esta empresa diversificada mantiene su ventaja competitiva en un entorno empresarial global cada vez más desafiante. Desde su sólida integración vertical hasta operaciones internacionales estratégicas, Seaboard Corporation demuestra una notable resistencia y potencial para un crecimiento continuo en 2024 y más allá.
Seaboard Corporation (SEB) - Análisis FODA: Fortalezas
Modelo de negocio diversificado
Seaboard Corporation opera en múltiples segmentos comerciales con desglose de ingresos de la siguiente manera:
| Segmento de negocios | Contribución de ingresos |
|---|---|
| Operaciones marinas | 24.3% |
| Comercio de productos básicos | 31.7% |
| Agricultura | 18.5% |
| Procesamiento de alimentos | 25.5% |
Presencia internacional
Seaboard Corporation opera en 14 países en múltiples continentes:
- América del norte
- Sudamerica
- Europa
- África
- Asia
Desempeño financiero
Métricas financieras para el año fiscal más reciente:
| Métrica financiera | Valor |
|---|---|
| Ingresos totales | $ 7.2 mil millones |
| Lngresos netos | $ 412 millones |
| Margen de beneficio bruto | 18.3% |
| Retorno sobre la equidad | 12.7% |
Cadena de suministro integrada verticalmente
Integración de la cadena de suministro en los segmentos de negocios:
- Posee instalaciones de producción agrícola
- Controla las plataformas de comercio de productos básicos
- Opera plantas de procesamiento de alimentos
- Administra la infraestructura de transporte marino
Estrategia de gestión de riesgos
El enfoque de gestión de riesgos incluye:
- Estrategias de cobertura en los mercados de productos básicos
- Diversificación geográfica
- Inversión en tecnología e infraestructura
- Mantenimiento $ 624 millones en activos líquidos
Seaboard Corporation (SEB) - Análisis FODA: debilidades
Estructura corporativa compleja que limita la transparencia
Seboard Corporation opera en múltiples segmentos comerciales con interconexiones complejas, que pueden oscurecer la visibilidad financiera. A partir de 2023, los ingresos anuales de la compañía fueron de $ 7.86 mil millones, distribuidos en diversas áreas operativas, incluida la producción agrícola, el comercio de productos básicos y el procesamiento.
| Segmento de negocios | Contribución de ingresos | Factor de complejidad |
|---|---|---|
| Molienda | $ 1.2 mil millones | Alto |
| Comercio de productos básicos | $ 2.3 mil millones | Muy alto |
| Producción agrícola | $ 3.5 mil millones | Moderado |
Alta dependencia de las fluctuaciones globales de los precios de los productos básicos
El desempeño financiero de la compañía es significativamente vulnerable a la volatilidad del precio de los productos básicos. En 2023, las fluctuaciones de los precios de los productos agrícolas afectaron los márgenes brutos de la compañía en aproximadamente 15-18%.
- Volatilidad del precio del maíz: +/- 22% Variación anual
- Fluctuación del precio del trigo: +/- Rango anual de 19%
- Sensibilidad al precio de los productos básicos de cerdo: +/- 25% de desviación anual
Reconocimiento limitado de la marca del consumidor
Seaboard Corporation carece de una fuerte presencia de marca de consumo directo en comparación con las compañías agrícolas más grandes. La investigación de mercado indica el reconocimiento de la marca en aproximadamente el 12%entre los consumidores generales, significativamente más bajo que los competidores como Cargill (38%) y ADM (29%).
Capitalización de mercado relativamente pequeña
A partir de enero de 2024, la capitalización de mercado de Seaboard Corporation es de $ 4.2 mil millones, lo que restringe las capacidades de inversión a gran escala y posibles adquisiciones estratégicas.
| Métrica financiera | Valor 2023 | Posición comparativa |
|---|---|---|
| Capitalización de mercado | $ 4.2 mil millones | Debajo de la mediana de la industria |
| Gastos de capital anuales | $ 320 millones | Capacidad de expansión limitada |
Intereses comerciales geográficos concentrados
Las operaciones de Seaboard Corporation se concentran en regiones específicas, principalmente América del Norte y mercados internacionales seleccionados. La concentración geográfica expone a la empresa a factores de riesgo económicos y agrícolas regionales.
- América del Norte: 68% de las operaciones comerciales totales
- América Latina: 22% de las operaciones comerciales totales
- Diversificación internacional: limitado al 10% de los ingresos totales
Seaboard Corporation (SEB) - Análisis FODA: oportunidades
Expandir la demanda de alimentos globales creando potencial de crecimiento
El mercado agrícola global proyectado para alcanzar los $ 15.7 billones para 2028, con una tasa compuesta anual de 6.2%. Los ingresos actuales de producción de alimentos globales de Seaboard Corporation son de $ 2.3 mil millones en 2023.
| Segmento de mercado | Tasa de crecimiento proyectada | Impacto potencial de ingresos |
|---|---|---|
| Producción de granos | 4.5% CAGR | Potencial de ingresos adicionales de $ 650 millones |
| Procesamiento de proteínas | 5.8% CAGR | Potencial de ingresos adicionales de $ 450 millones |
Innovación tecnológica en la producción agrícola
Se espera que el mercado de tecnología agrícola alcance los $ 34.8 mil millones para 2026, con tecnologías agrícolas de precisión que crecen en 12.7% anuales.
- Inversión actual de I + D: $ 42 millones en 2023
- Mejoras de eficiencia potencial: 18-22% en el rendimiento de los cultivos
- Ahorro de integración tecnológica proyectada: $ 75-90 millones anualmente
Oportunidades del mercado de economías emergentes
Los mercados emergentes del sector agrícola valorado en $ 5.8 billones, con un potencial de crecimiento significativo en Asia y África.
| Región | Valor de mercado agrícola | Crecimiento proyectado |
|---|---|---|
| Sudeste de Asia | $ 1.2 billones | 7.3% CAGR |
| África subsahariana | $ 650 mil millones | 6.9% CAGR |
Métodos de producción de alimentos sostenibles
El mercado global de agricultura sostenible proyectada para llegar a $ 24.3 mil millones para 2028, con un 9,2% de TCAC.
- Inversiones agrícolas sostenibles actuales: $ 35 millones
- Reducción potencial de carbono: 22-25% en operaciones agrícolas
- Ingresos estimados de productos sostenibles: $ 180-220 millones para 2026
Adquisiciones estratégicas y expansión comercial
Posibles objetivos de adquisición en sectores relacionados con un valor de mercado estimado de $ 750-900 millones.
| Sector potencial | Tamaño del mercado | Potencial de adquisición |
|---|---|---|
| Tecnología agrícola | $ 450 millones | Alto potencial de integración |
| Procesamiento de alimentos especializados | $ 350 millones | Potencial de integración media |
Seaboard Corporation (SEB) - Análisis FODA: amenazas
Mercados internacionales volátiles e inestabilidad de precios
En 2023, la volatilidad del precio global de productos agrícolas alcanzó niveles significativos:
| Producto | Rango de volatilidad de precios | Fluctuación anual |
|---|---|---|
| Maíz | $ 4.25 - $ 6.75 por bushel | 37.6% Variación de precios |
| Trigo | $ 6.50 - $ 9.25 por bushel | 42.3% Variación de precios |
| Soja | $ 12.50 - $ 16.75 por bushel | 34.0% Variación de precios |
Aumento de las tensiones comerciales globales y posibles cambios regulatorios
Las tensiones comerciales impactan las operaciones internacionales de Seaboard:
- Los aranceles comerciales de US-China alcanzan el 25% en productos agrícolas
- Las restricciones de importación agrícola de la Unión Europea aumentaron en un 18%
- Posibles costos de cumplimiento regulatorio adicional estimados en $ 14.3 millones anuales
Impactos del cambio climático en la producción agrícola y las cadenas de suministro
Riesgos de producción agrícola relacionados con el clima:
| Impacto climático | Reducción estimada de producción | Proyección de pérdidas económicas |
|---|---|---|
| Condiciones de sequía | 12-15% de reducción de rendimiento de cultivos | $ 42.6 millones Pérdida de ingresos potenciales |
| Eventos meteorológicos extremos | 8-10% de interrupción agrícola | $ 31.2 millones de impacto en la cadena de suministro |
Competencia intensa en sectores de comercio agrícola y de productos básicos
Análisis de panorama competitivo:
- Los 5 principales competidores controlan el 62% de la participación de mercado
- Los márgenes de beneficio promedio en el sector reducidos al 3.7%
- Se estima $ 25.8 millones requeridos para el posicionamiento competitivo
Posibles interrupciones de la cadena de suministro de incertidumbres geopolíticas
Evaluación de riesgos geopolíticos:
| Región | Probabilidad de interrupción | Impacto económico potencial |
|---|---|---|
| Europa Oriental | 37% de riesgo de interrupción de la cadena de suministro | $ 18.5 millones Pérdidas potenciales |
| Oriente Medio | 42% de la ruta de transporte Incertidumbre | $ 22.7 millones Potencial interrupción |
Seaboard Corporation (SEB) - SWOT Analysis: Opportunities
Global expansion potential in emerging markets from 45-country base
You already have a massive footprint, so the opportunity here is simply to deepen your market penetration in high-growth regions. Seaboard Corporation operates in more than 45 countries globally, with a strong focus on Latin America, the Caribbean, and Africa. This diversified base provides a natural hedge against single-market economic volatility.
The Commodity Trading and Milling (CT&M) segment, in particular, is positioned to capitalize on rising demand for essential goods in these emerging markets. Your pork products are already exported extensively to Asia and Latin America, and the Marine segment is strengthening its key trade routes connecting the U.S. with Central and South America. The infrastructure is in place; now it's about optimizing the supply chain to capture more volume. That's a huge competitive advantage.
Legislative tailwinds like restored 100% bonus depreciation for investments
This is a major, concrete financial tailwind you need to act on immediately. The 'One Big Beautiful Bill Act' was signed into law in July 2025, and it permanently restores 100% bonus depreciation for qualified property placed in service after January 19, 2025.
For a capital-intensive business like Seaboard, which is heavily invested in vessels, milling equipment, and processing plants, this change significantly lowers the after-tax cost of new assets. It boosts your cash flow by allowing you to immediately expense the full cost of eligible purchases, not just the 40% rate that was in effect for most of 2025 under the old law. This tax relief is a direct subsidy for your planned capital improvements.
Continued capital investment, budgeting $630 million for 2025
Your commitment to significant capital expenditure (CapEx) in 2025 signals a clear focus on long-term efficiency and capacity. The company is planning to invest approximately $630 million in capital expenditures for the full 2025 fiscal year, primarily targeting the Marine and Pork segments. This level of investment is crucial for maintaining your competitive edge and modernizing your fleet and facilities.
Here's the quick math: committing to this CapEx, especially in the Marine segment, right as the 100% bonus depreciation is restored, maximizes the immediate tax benefit. You are spending money to make money, and the government is helping finance the initial outlay through tax savings.
Marine segment growth from new dual-fueled vessels, improving efficiency
The Marine segment's fleet modernization is one of the most exciting, tangible opportunities for Seaboard. You are integrating a new class of dual-fueled vessels, primarily powered by Liquefied Natural Gas (LNG), which is a cleaner, more efficient fuel alternative.
By the end of 2025, your fleet is expected to feature a total of nine LNG-powered ships, including the retrofitted Seaboard Blue. These new V-Class vessels, like the Seaboard Verde and Seaboard Victory, bring substantially increased capacity and efficiency to your core routes in the Americas.
The new V-Class vessels offer a significant step up in operational capability:
- Capacity per vessel: 3,500 TEUs (Twenty-foot Equivalent Units).
- Refrigerated capacity: Over 1,000 refrigerated container plugs per vessel.
- Operational benefit: Greater fuel efficiency and increased tonnage capacity.
This increased refrigerated capacity is defintely key for your integrated food operations, ensuring the seamless and reliable transport of perishable cargo like the pork and produce you handle.
| 2025 Opportunity Metric | Key Financial/Operational Data | Primary Business Segment Impacted |
|---|---|---|
| Planned Capital Expenditure (CapEx) | Approximately $630 million for 2025 | Marine, Pork |
| New Vessels Integrated (by EOY 2025) | Total of 9 LNG-powered ships (including 1 retrofitted) | Marine |
| New Vessel Capacity (V-Class) | 3,500 TEUs and over 1,000 refrigerated plugs | Marine, Pork |
| Tax Depreciation Tailwind | 100% bonus depreciation restored (for property placed in service after Jan 19, 2025) | All Segments (CapEx-heavy) |
| Global Reach | Operations in more than 45 countries | CT&M, Marine, Pork, Power |
Seaboard Corporation (SEB) - SWOT Analysis: Threats
You're looking at Seaboard Corporation's threats, and the picture is one of high-stakes global volatility. The biggest near-term risks aren't just market dips; they are legal battles and geopolitical shifts that could directly impact your core profit centers, especially the Marine and Pork segments. We defintely need to map out the financial exposure here.
Tariffs and trade restrictions impacting international trade operations
As a global agribusiness and ocean transportation company, Seaboard Corporation is highly exposed to shifting international trade policies. The most immediate threat comes from the ongoing U.S.-China trade tensions, specifically concerning the Pork segment. China, a key export destination, imposed retaliatory tariffs on U.S. pork in April 2025.
While management stated the tariffs did not materially impact the Pork segment's results in the first half of 2025, this is a clear risk. Here's the quick math: China represented 3% of the Pork segment's total sales in the year ended December 31, 2024. Any escalation of tariffs could quickly erode margins on that portion of your business, forcing you to redirect volumes to less profitable markets.
Also, the Marine segment is actively managing rising operational costs due to global trade dynamics. For example, Seaboard Marine implemented a General Rate Increase (GRI) for all non-U.S. trade lanes, effective January 5, 2025, and a bunker increase (fuel surcharge) effective September 14, 2025. These increases are a direct response to external cost pressures, which can make your shipping services less competitive against rivals who can absorb or manage these costs better.
Intense competitive pressures across all agricultural and transport sectors
Seaboard Corporation operates in highly fragmented and competitive markets, meaning margins are constantly under pressure. In the Pork segment, you're up against giants like Smithfield Foods Inc and Perdue Farms Inc, who have massive scale. In the Commodity Trading and Milling (CT&M) segment, you compete with global traders like Bunge, which can often secure better pricing and logistics terms.
A newer, structural threat is the rise of alternative proteins. The global plant-based protein market is projected to reach $20.33 billion in 2025, growing at a much faster rate than the traditional packaged red meat market, which is projected to be $101.06 billion in the U.S. in 2025. This trend threatens to cap the long-term growth and pricing power of your core Pork products.
The Marine segment also faces intense competition on key routes in the U.S., Caribbean, and Central/South America. New vessel capacity from competitors can quickly depress freight rates, which is a significant variable for your Marine segment's profitability.
Risk from the Helms-Burton legal calendar, with a trial window starting February 2026
The most significant and quantifiable legal threat is the litigation under Title III of the Helms-Burton Act (Cuban Liberty and Democratic Solidarity (LIBERTAD) Act). The case, de Fernandez v. Seaboard Marine Ltd., alleges that Seaboard Marine is 'trafficking' in property confiscated by the Cuban government.
The Eleventh Circuit Court of Appeals recently reversed a summary judgment in Seaboard's favor concerning the land once owned by Azucarera Mariel, S.A., finding sufficient evidence that Seaboard Marine's commercial activities benefited from the confiscated property. This means the case is moving forward. To be fair, Seaboard Marine filed a petition for a writ of certiorari with the U.S. Supreme Court on September 8, 2025, challenging the Eleventh Circuit's broad interpretation of 'trafficking.'
What this estimate hides is the potential liability: the Act allows for the recovery of damages, which can be trebled if the defendant continued to violate the Act after notification. A loss in this case could result in a substantial, non-operating charge that would materially impact the balance sheet.
Commodity price declines could reduce profitability, despite hedging
The volatility in commodity markets remains a persistent threat, especially since your profitability is tied to the spread between input costs and selling prices for pork, grain, and other commodities. While the Commodity Trading and Milling (CT&M) segment partially hedges the Pork operations, the protection is not absolute.
For example, in the third quarter of 2025, Seaboard Corporation reported a net income of $110 million, a significant turnaround from the $149 million net loss in Q3 2024. Still, the CT&M segment saw its sales increase due to higher volumes, but this was 'partially offset by lower commodity prices.' This shows that even with volume growth and hedging, price declines are a powerful headwind.
Here's a snapshot of the Pork segment's razor-thin operational margin in Q3 2025, which is highly sensitive to price fluctuations:
| Metric (Q3 2025) | Amount (in millions) |
|---|---|
| Pork Segment Net Sales | $544 million |
| Pork Segment Cost of Sales | $458 million |
| Gross Profit | $86 million |
A small drop in pork selling prices or a rise in feed costs (corn and soybeans) could quickly wipe out that $86 million gross profit, pulling the entire segment back into a loss, as it did in Q3 2024.
Disclaimer
All information, articles, and product details provided on this website are for general informational and educational purposes only. We do not claim any ownership over, nor do we intend to infringe upon, any trademarks, copyrights, logos, brand names, or other intellectual property mentioned or depicted on this site. Such intellectual property remains the property of its respective owners, and any references here are made solely for identification or informational purposes, without implying any affiliation, endorsement, or partnership.
We make no representations or warranties, express or implied, regarding the accuracy, completeness, or suitability of any content or products presented. Nothing on this website should be construed as legal, tax, investment, financial, medical, or other professional advice. In addition, no part of this site—including articles or product references—constitutes a solicitation, recommendation, endorsement, advertisement, or offer to buy or sell any securities, franchises, or other financial instruments, particularly in jurisdictions where such activity would be unlawful.
All content is of a general nature and may not address the specific circumstances of any individual or entity. It is not a substitute for professional advice or services. Any actions you take based on the information provided here are strictly at your own risk. You accept full responsibility for any decisions or outcomes arising from your use of this website and agree to release us from any liability in connection with your use of, or reliance upon, the content or products found herein.