
|
Valoración DCF de SmartFinancial, Inc. (SMBK) |
Completamente Editable: Adáptelo A Sus Necesidades En Excel O Sheets
Diseño Profesional: Plantillas Confiables Y Estándares De La Industria
Predeterminadas Para Un Uso Rápido Y Eficiente
Compatible con MAC / PC, completamente desbloqueado
No Se Necesita Experiencia; Fáciles De Seguir
SmartFinancial, Inc. (SMBK) Bundle
¿Busca determinar el valor intrínseco de SmartFinancial, Inc.? Nuestra calculadora SMBK DCF integra datos del mundo real con extensas características de personalización, lo que le permite refinar sus proyecciones y tomar decisiones de inversión más informadas.
What You Will Get
- Real SmartFinancial Data: Preloaded financials – from revenue to EBIT – based on actual and projected figures for SmartFinancial, Inc. (SMBK).
- Full Customization: Adjust all critical parameters (yellow cells) like WACC, growth %, and tax rates specific to SmartFinancial, Inc. (SMBK).
- Instant Valuation Updates: Automatic recalculations to analyze the impact of changes on SmartFinancial, Inc.'s (SMBK) fair value.
- Versatile Excel Template: Tailored for quick edits, scenario testing, and detailed projections for SmartFinancial, Inc. (SMBK).
- Time-Saving and Accurate: Skip building models from scratch while maintaining precision and flexibility for SmartFinancial, Inc. (SMBK).
Key Features
- Comprehensive Data: Access SmartFinancial’s historical financial reports and pre-filled projections.
- Customizable Parameters: Adjust WACC, tax rates, revenue growth, and EBITDA margins as needed.
- Real-Time Calculations: View SmartFinancial’s intrinsic value update instantly.
- Visual Insights: Interactive dashboard charts showcase valuation outcomes and essential metrics.
- Designed for Precision: A reliable tool tailored for analysts, investors, and finance professionals.
How It Works
- Download: Get the pre-prepared Excel file containing SmartFinancial, Inc.'s (SMBK) financial data.
- Customize: Modify projections, such as revenue growth, EBITDA %, and WACC.
- Update Automatically: Watch as intrinsic value and NPV calculations refresh in real-time.
- Test Scenarios: Develop various forecasts and instantly compare the results.
- Make Decisions: Utilize the valuation outcomes to inform your investment approach.
Why Choose SmartFinancial, Inc. (SMBK) Calculator?
- Precision: Utilizes real SmartFinancial data for reliable calculations.
- Adaptability: Allows users to easily experiment with and adjust inputs.
- Efficiency: Eliminate the need to create a financial model from the ground up.
- Expert-Level: Crafted with the accuracy and functionality expected by finance professionals.
- Intuitive: Simple interface designed for users of all financial backgrounds.
Who Should Use This Product?
- Investors: Evaluate SmartFinancial, Inc. (SMBK) for informed investment decisions.
- CFOs and Financial Analysts: Optimize valuation methods and assess financial forecasts.
- Startup Founders: Understand valuation strategies of established financial firms like SmartFinancial, Inc. (SMBK).
- Consultants: Create detailed valuation reports for clients utilizing SmartFinancial, Inc. (SMBK) data.
- Students and Educators: Apply real-world financial data to enhance learning in valuation practices.
What the Template Contains
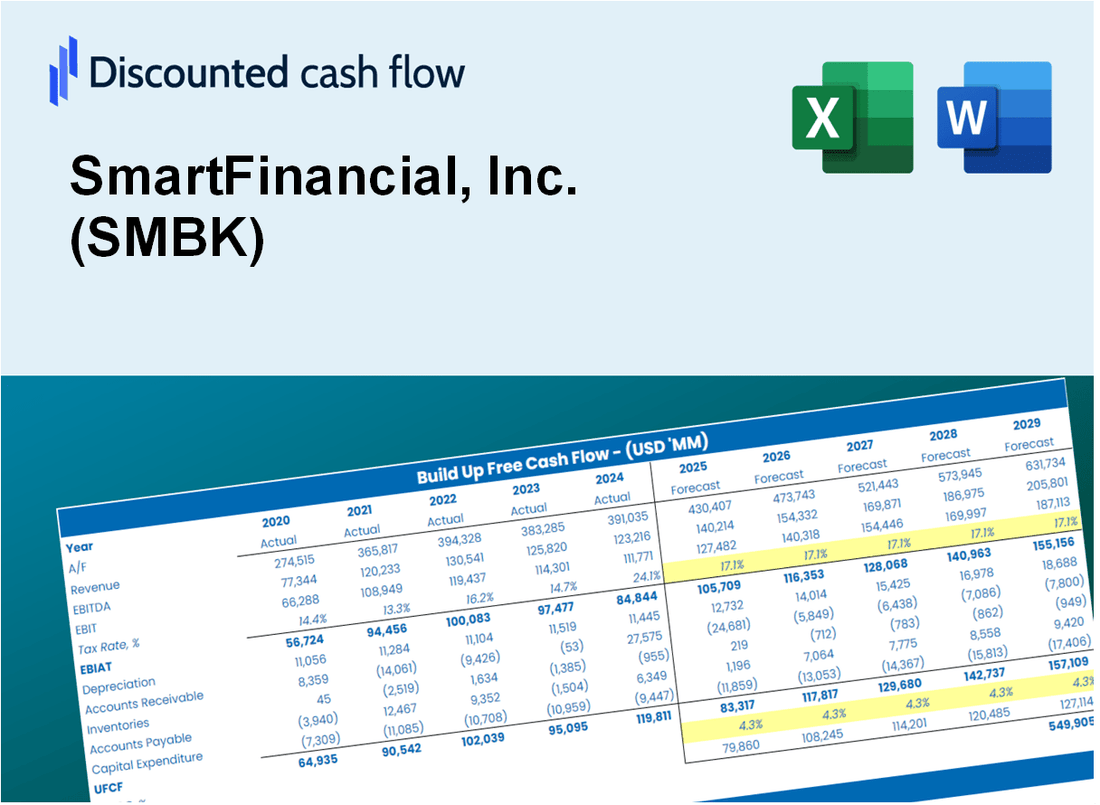
- Operating and Balance Sheet Data: Pre-filled SmartFinancial, Inc. historical data and forecasts, including revenue, EBITDA, EBIT, and capital expenditures.
- WACC Calculation: A dedicated sheet for Weighted Average Cost of Capital (WACC), including parameters like Beta, risk-free rate, and share price.
- DCF Valuation (Unlevered and Levered): Editable Discounted Cash Flow models showing intrinsic value with detailed calculations.
- Financial Statements: Pre-loaded financial statements (annual and quarterly) to support analysis.
- Key Ratios: Includes profitability, leverage, and efficiency ratios for SmartFinancial, Inc. (SMBK).
- Dashboard and Charts: Visual summary of valuation outputs and assumptions to analyze results easily.
Disclaimer
All information, articles, and product details provided on this website are for general informational and educational purposes only. We do not claim any ownership over, nor do we intend to infringe upon, any trademarks, copyrights, logos, brand names, or other intellectual property mentioned or depicted on this site. Such intellectual property remains the property of its respective owners, and any references here are made solely for identification or informational purposes, without implying any affiliation, endorsement, or partnership.
We make no representations or warranties, express or implied, regarding the accuracy, completeness, or suitability of any content or products presented. Nothing on this website should be construed as legal, tax, investment, financial, medical, or other professional advice. In addition, no part of this site—including articles or product references—constitutes a solicitation, recommendation, endorsement, advertisement, or offer to buy or sell any securities, franchises, or other financial instruments, particularly in jurisdictions where such activity would be unlawful.
All content is of a general nature and may not address the specific circumstances of any individual or entity. It is not a substitute for professional advice or services. Any actions you take based on the information provided here are strictly at your own risk. You accept full responsibility for any decisions or outcomes arising from your use of this website and agree to release us from any liability in connection with your use of, or reliance upon, the content or products found herein.