
|
Valoración de DCF de Zomato Limited (Zomato.NS) |
Completamente Editable: Adáptelo A Sus Necesidades En Excel O Sheets
Diseño Profesional: Plantillas Confiables Y Estándares De La Industria
Predeterminadas Para Un Uso Rápido Y Eficiente
Compatible con MAC / PC, completamente desbloqueado
No Se Necesita Experiencia; Fáciles De Seguir
Zomato Limited (ZOMATO.NS) Bundle
¡Ahorre tiempo y mejore la precisión con nuestra calculadora DCF (Zomatons)! Utilizando datos reales de Zomato y supuestos personalizables, esta herramienta le permite pronosticar, analizar y evaluar Zomato Limited como un inversor experto.
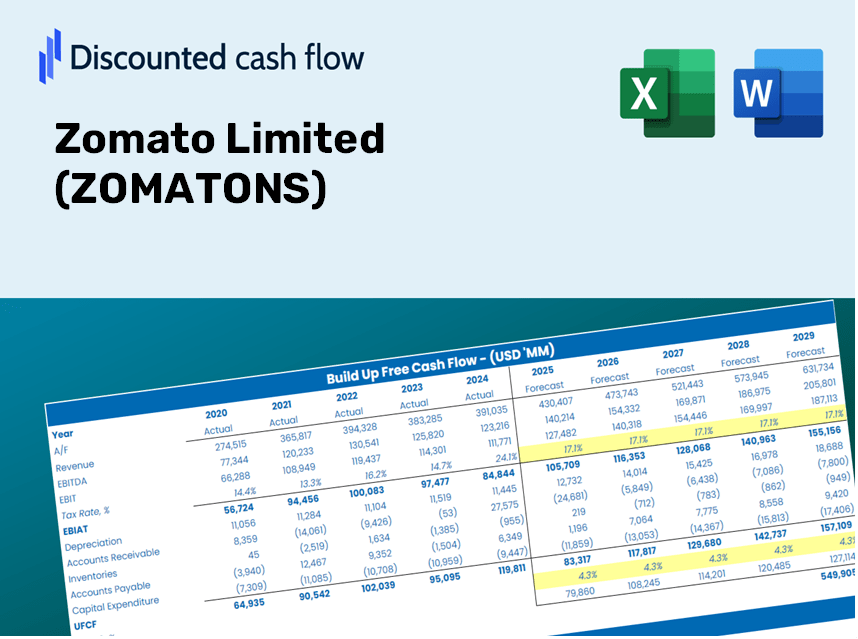
Discounted Cash Flow (DCF) - (USD MM)
| Year | AY1 2019 |
AY2 2020 |
AY3 2021 |
AY4 2022 |
AY5 2023 |
FY1 2024 |
FY2 2025 |
FY3 2026 |
FY4 2027 |
FY5 2028 |
|---|---|---|---|---|---|---|---|---|---|---|
| Revenue | 26,047.4 | 19,937.9 | 41,924.0 | 70,794.0 | 121,140.0 | 186,714.2 | 287,784.3 | 443,564.5 | 683,670.0 | 1,053,746.8 |
| Revenue Growth, % | 0 | -23.46 | 110.27 | 68.86 | 71.12 | 54.13 | 54.13 | 54.13 | 54.13 | 54.13 |
| EBITDA | -22,887.3 | -6,673.0 | -10,585.0 | -5,287.0 | 8,890.0 | -54,787.3 | -84,444.2 | -130,154.6 | -200,608.4 | -309,199.6 |
| EBITDA, % | -87.87 | -33.47 | -25.25 | -7.47 | 7.34 | -29.34 | -29.34 | -29.34 | -29.34 | -29.34 |
| Depreciation | 842.4 | 1,377.4 | 1,503.0 | 4,369.0 | 5,260.0 | 9,052.3 | 13,952.5 | 21,505.1 | 33,145.9 | 51,088.1 |
| Depreciation, % | 3.23 | 6.91 | 3.59 | 6.17 | 4.34 | 4.85 | 4.85 | 4.85 | 4.85 | 4.85 |
| EBIT | -23,729.7 | -8,050.4 | -12,088.0 | -9,656.0 | 3,630.0 | -63,839.7 | -98,396.6 | -151,659.6 | -233,754.4 | -360,287.7 |
| EBIT, % | -91.1 | -40.38 | -28.83 | -13.64 | 3 | -34.19 | -34.19 | -34.19 | -34.19 | -34.19 |
| Total Cash | 7,949.4 | 37,384.5 | 66,992.0 | 99,195.0 | 34,050.0 | 133,921.4 | 206,414.3 | 318,148.3 | 490,364.9 | 755,803.8 |
| Total Cash, percent | .0 | .0 | .0 | .0 | .0 | .0 | .0 | .0 | .0 | .0 |
| Account Receivables | 1,231.2 | 1,550.2 | 1,599.0 | 9,462.0 | 7,940.0 | 13,531.4 | 20,856.1 | 32,145.7 | 49,546.5 | 76,366.5 |
| Account Receivables, % | 4.73 | 7.78 | 3.81 | 13.37 | 6.55 | 7.25 | 7.25 | 7.25 | 7.25 | 7.25 |
| Inventories | 37.3 | 148.0 | 397.0 | 827.0 | 880.0 | 1,391.7 | 2,145.0 | 3,306.2 | 5,095.8 | 7,854.2 |
| Inventories, % | 0.14309 | 0.74215 | 0.94695 | 1.17 | 0.72643 | 0.74536 | 0.74536 | 0.74536 | 0.74536 | 0.74536 |
| Accounts Payable | 2,687.3 | 2,972.0 | 4,288.0 | 6,790.0 | 8,860.0 | 19,551.4 | 30,134.8 | 46,447.0 | 71,589.1 | 110,341.0 |
| Accounts Payable, % | 10.32 | 14.91 | 10.23 | 9.59 | 7.31 | 10.47 | 10.47 | 10.47 | 10.47 | 10.47 |
| Capital Expenditure | -214.4 | -104.4 | -590.0 | -1,030.0 | -2,150.0 | -2,234.5 | -3,444.1 | -5,308.4 | -8,181.9 | -12,610.9 |
| Capital Expenditure, % | -0.82315 | -0.52363 | -1.41 | -1.45 | -1.77 | -1.2 | -1.2 | -1.2 | -1.2 | -1.2 |
| Tax Rate, % | -20.62 | -20.62 | -20.62 | -20.62 | -20.62 | -20.62 | -20.62 | -20.62 | -20.62 | -20.62 |
| EBITAT | -23,546.2 | -8,027.6 | -11,971.1 | -9,243.9 | 4,378.5 | -63,036.5 | -97,158.7 | -149,751.5 | -230,813.4 | -355,754.8 |
| Depreciation | ||||||||||
| Changes in Account Receivables | ||||||||||
| Changes in Inventories | ||||||||||
| Changes in Accounts Payable | ||||||||||
| Capital Expenditure | ||||||||||
| UFCF | -21,499.3 | -6,899.6 | -10,040.0 | -11,695.9 | 11,027.5 | -51,630.4 | -84,145.0 | -129,693.4 | -199,897.6 | -308,104.0 |
| WACC, % | 5.36 | 5.36 | 5.36 | 5.35 | 5.36 | 5.36 | 5.36 | 5.36 | 5.36 | 5.36 |
| PV UFCF | ||||||||||
| SUM PV UFCF | -635,318.7 | |||||||||
| Long Term Growth Rate, % | 2.00 | |||||||||
| Free cash flow (T + 1) | -314,266 | |||||||||
| Terminal Value | -9,364,634 | |||||||||
| Present Terminal Value | -7,214,344 | |||||||||
| Enterprise Value | -7,849,663 | |||||||||
| Net Debt | 4,400 | |||||||||
| Equity Value | -7,854,063 | |||||||||
| Diluted Shares Outstanding, MM | 8,755 | |||||||||
| Equity Value Per Share | -897.07 |
What You Will Receive
- Genuine Zomato Data: Preloaded financial metrics – encompassing revenue to EBIT – derived from actual and projected figures.
- Complete Customization: Modify all essential parameters (yellow cells) such as WACC, growth %, and tax rates.
- Real-Time Valuation Updates: Automatic recalculations to assess the effects of changes on Zomato’s fair value.
- Flexible Excel Template: Designed for quick edits, scenario analysis, and comprehensive projections.
- Efficient and Precise: Bypass the hassle of building models from the ground up while ensuring accuracy and adaptability.
Key Features
- Comprehensive Zomato Financials: Gain access to precise pre-loaded historical data and future forecasts.
- Tailorable Forecast Assumptions: Modify yellow-highlighted fields including WACC, growth rates, and profit margins.
- Real-Time Calculations: Enjoy automatic updates for DCF, Net Present Value (NPV), and cash flow analysis.
- Interactive Dashboard: Clear, easy-to-read charts and summaries for visualizing your valuation outcomes.
- Designed for All Skill Levels: A user-friendly layout perfect for investors, CFOs, and consultants alike.
How It Works
- 1. Download the Template: Obtain and open the Excel file containing Zomato Limited’s preloaded data.
- 2. Adjust Key Assumptions: Modify essential inputs such as growth rates, WACC, and capital expenditures.
- 3. Instant Results: The DCF model automatically computes the intrinsic value and NPV in real-time.
- 4. Explore Various Scenarios: Evaluate multiple forecasts to investigate different valuation possibilities.
- 5. Make Informed Decisions: Share professional valuation insights to enhance your decision-making process.
Why Opt for the Zomato Calculator?
- Precision: Utilizing accurate Zomato financial data for reliable results.
- Versatility: Built for users to easily adjust and experiment with inputs.
- Efficiency: Eliminate the need to create a DCF model from the ground up.
- Top-Tier Quality: Crafted with the insight and standards expected at the CFO level.
- Intuitive Interface: Simple to navigate, even for those without extensive financial modeling knowledge.
Who Can Benefit from Zomato Limited (ZOMATONS)?
- Individual Investors: Gain insights to make better decisions on buying or selling Zomato shares.
- Financial Analysts: Enhance your analysis with user-friendly financial models tailored for Zomato.
- Consultants: Provide clients with accurate valuation assessments of Zomato swiftly and effectively.
- Business Owners: Learn how companies like Zomato are valued to inform your own business strategies.
- Finance Students: Acquire practical knowledge of valuation methods through real-world applications involving Zomato.
Contents of the Template
- In-Depth DCF Model: An editable template featuring comprehensive valuation calculations.
- Real-Time Data: Zomato Limited’s (ZOMATONS) historical and projected financials included for analysis.
- Flexible Parameters: Modify WACC, growth rates, and tax assumptions to explore different scenarios.
- Financial Statements: Complete annual and quarterly reports for detailed insights.
- Essential Ratios: Integrated analysis for profitability, efficiency, and leverage metrics.
- Visual Dashboard: Charts and tables providing clear, actionable insights.
Disclaimer
All information, articles, and product details provided on this website are for general informational and educational purposes only. We do not claim any ownership over, nor do we intend to infringe upon, any trademarks, copyrights, logos, brand names, or other intellectual property mentioned or depicted on this site. Such intellectual property remains the property of its respective owners, and any references here are made solely for identification or informational purposes, without implying any affiliation, endorsement, or partnership.
We make no representations or warranties, express or implied, regarding the accuracy, completeness, or suitability of any content or products presented. Nothing on this website should be construed as legal, tax, investment, financial, medical, or other professional advice. In addition, no part of this site—including articles or product references—constitutes a solicitation, recommendation, endorsement, advertisement, or offer to buy or sell any securities, franchises, or other financial instruments, particularly in jurisdictions where such activity would be unlawful.
All content is of a general nature and may not address the specific circumstances of any individual or entity. It is not a substitute for professional advice or services. Any actions you take based on the information provided here are strictly at your own risk. You accept full responsibility for any decisions or outcomes arising from your use of this website and agree to release us from any liability in connection with your use of, or reliance upon, the content or products found herein.