
|
Keyence Corporation (6861.T) Évaluation DCF |
Entièrement Modifiable: Adapté À Vos Besoins Dans Excel Ou Sheets
Conception Professionnelle: Modèles Fiables Et Conformes Aux Normes Du Secteur
Pré-Construits Pour Une Utilisation Rapide Et Efficace
Compatible MAC/PC, entièrement débloqué
Aucune Expertise N'Est Requise; Facile À Suivre
Keyence Corporation (6861.T) Bundle
Rationalisez votre analyse et améliorez la précision avec notre calculatrice [symbole] DCF! En utilisant des données réelles de Keyence Corporation et des hypothèses personnalisables, cet outil vous permet de prévoir, d'évaluer et de valoriser la clé comme un investisseur chevronné.
What You Will Receive
- Comprehensive Financial Model: Keyence’s actual data facilitates accurate DCF valuation.
- Complete Forecasting Control: Modify revenue growth, profit margins, WACC, and other essential drivers.
- Real-Time Calculations: Automatic updates allow you to view results instantly as adjustments are made.
- Professional-Grade Template: A polished Excel file specifically designed for high-quality valuations.
- Flexible and Reusable: Customized for versatility, enabling repeated use for in-depth forecasting.
Key Features
- Customizable Forecast Inputs: Adjust essential parameters such as revenue growth, EBITDA percentage, and capital expenditures.
- Instant DCF Valuation: Quickly computes intrinsic value, NPV, and other key financial metrics.
- High-Precision Accuracy: Utilizes Keyence's actual financial data for credible valuation results.
- Effortless Scenario Analysis: Easily explore various assumptions and evaluate different outcomes.
- Time-Efficient Solution: Remove the hassle of creating intricate valuation models from the ground up.
How It Functions
- Step 1: Download the Excel spreadsheet.
- Step 2: Examine the pre-filled Keyence Corporation (6861T) data (historical and projected).
- Step 3: Modify key assumptions (highlighted in yellow) according to your analysis.
- Step 4: Observe automatic updates for Keyence Corporation’s intrinsic value.
- Step 5: Utilize the results for investment strategies or reporting purposes.
Why Choose This Calculator for Keyence Corporation (6861T)?
- Reliable Data: Actual financials of Keyence ensure trustworthy valuation outcomes.
- Flexible: Tailor essential parameters such as growth rates, WACC, and tax rates to align with your forecasts.
- Efficient: Pre-configured calculations save you the time of starting from the ground up.
- High-Quality Tool: Crafted specifically for investors, analysts, and consultants.
- Easy to Use: User-friendly design and detailed instructions make navigation straightforward for everyone.
Who Can Benefit from This Product?
- Professional Investors: Create comprehensive and trustworthy valuation models for portfolio evaluation.
- Corporate Finance Teams: Evaluate valuation scenarios to inform internal decision-making strategies.
- Consultants and Advisors: Deliver precise valuation insights for Keyence Corporation (6861T) to clients.
- Students and Educators: Utilize real-world data to enhance financial modeling practices and instruction.
- Tech Enthusiasts: Gain insights into how technology firms like Keyence Corporation (6861T) are valued in the marketplace.
Contents of the Template
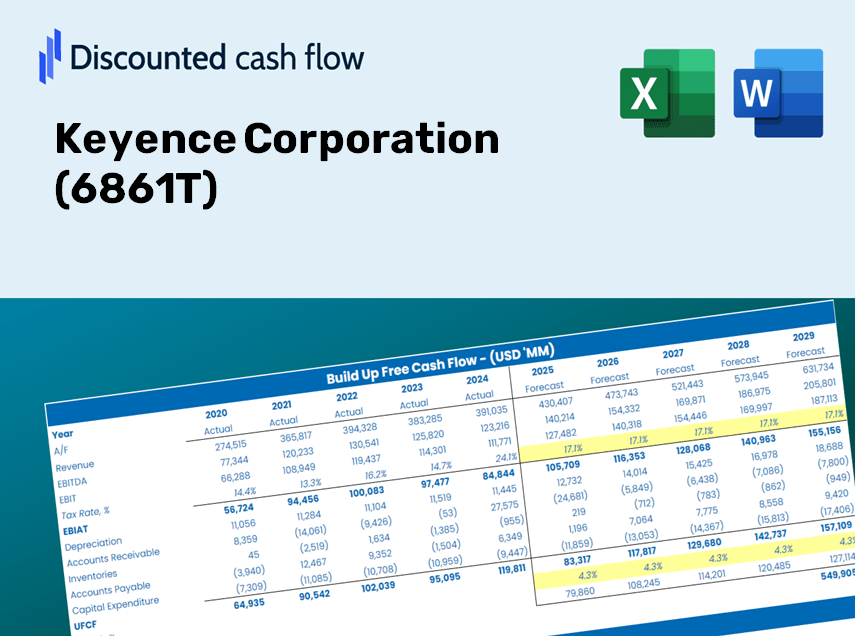
- Operating and Balance Sheet Data: Pre-filled historical data and forecasts for Keyence Corporation (6861T), including revenue, EBITDA, EBIT, and capital expenditures.
- WACC Calculation: A dedicated sheet for the Weighted Average Cost of Capital (WACC), featuring parameters such as Beta, risk-free rate, and share price.
- DCF Valuation (Unlevered and Levered): Customizable Discounted Cash Flow models that reveal intrinsic value along with comprehensive calculations.
- Financial Statements: Pre-loaded annual and quarterly financial statements to facilitate thorough analysis.
- Key Ratios: A collection of profitability, leverage, and efficiency ratios specific to Keyence Corporation (6861T).
- Dashboard and Charts: A visual overview of valuation outputs and assumptions to simplify result analysis.
Disclaimer
All information, articles, and product details provided on this website are for general informational and educational purposes only. We do not claim any ownership over, nor do we intend to infringe upon, any trademarks, copyrights, logos, brand names, or other intellectual property mentioned or depicted on this site. Such intellectual property remains the property of its respective owners, and any references here are made solely for identification or informational purposes, without implying any affiliation, endorsement, or partnership.
We make no representations or warranties, express or implied, regarding the accuracy, completeness, or suitability of any content or products presented. Nothing on this website should be construed as legal, tax, investment, financial, medical, or other professional advice. In addition, no part of this site—including articles or product references—constitutes a solicitation, recommendation, endorsement, advertisement, or offer to buy or sell any securities, franchises, or other financial instruments, particularly in jurisdictions where such activity would be unlawful.
All content is of a general nature and may not address the specific circumstances of any individual or entity. It is not a substitute for professional advice or services. Any actions you take based on the information provided here are strictly at your own risk. You accept full responsibility for any decisions or outcomes arising from your use of this website and agree to release us from any liability in connection with your use of, or reliance upon, the content or products found herein.