
|
CHIMED CORPORATION (CHE) Évaluation DCF |
Entièrement Modifiable: Adapté À Vos Besoins Dans Excel Ou Sheets
Conception Professionnelle: Modèles Fiables Et Conformes Aux Normes Du Secteur
Pré-Construits Pour Une Utilisation Rapide Et Efficace
Compatible MAC/PC, entièrement débloqué
Aucune Expertise N'Est Requise; Facile À Suivre
Chemed Corporation (CHE) Bundle
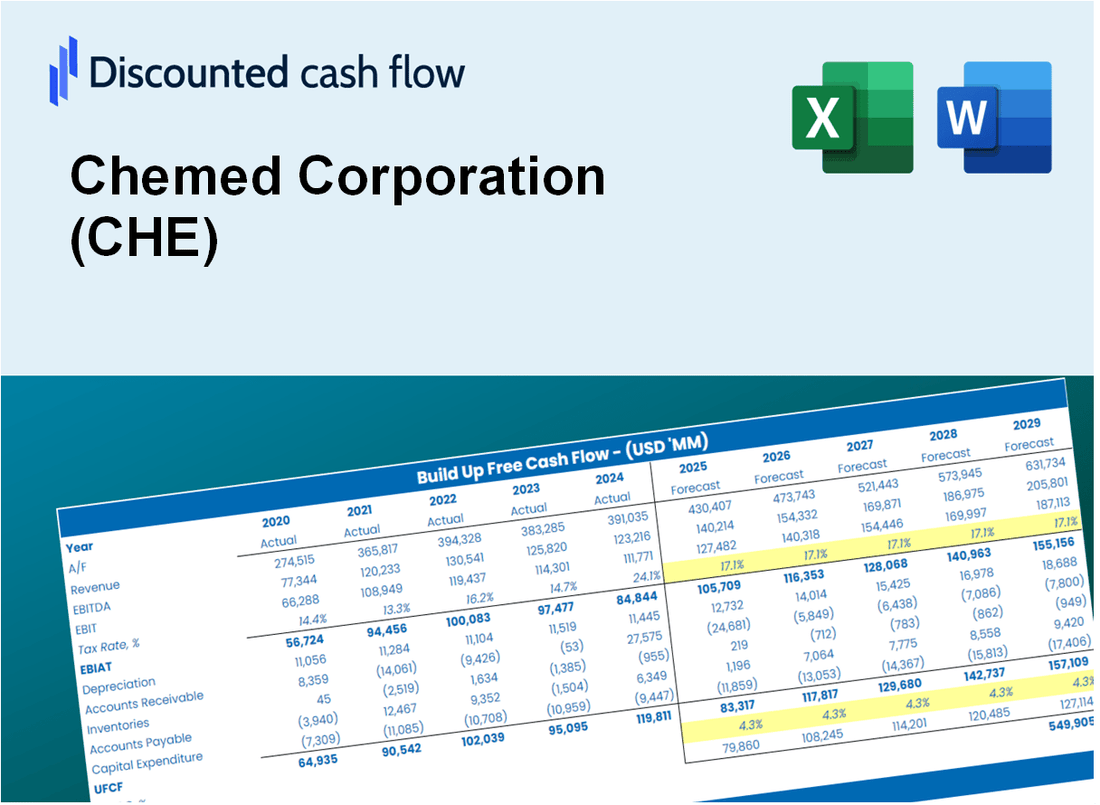
Améliorez vos choix d'investissement avec la calculatrice DCF de Chemed Corporation (CHE)! Utilisez des données financières authentiques, ajustez les projections et les dépenses de croissance et observez les effets immédiats sur la valeur intrinsèque de la société Chemed.
Discounted Cash Flow (DCF) - (USD MM)
| Year | AY1 2020 |
AY2 2021 |
AY3 2022 |
AY4 2023 |
AY5 2024 |
FY1 2025 |
FY2 2026 |
FY3 2027 |
FY4 2028 |
FY5 2029 |
|---|---|---|---|---|---|---|---|---|---|---|
| Revenue | 2,079.6 | 2,139.3 | 2,135.0 | 2,264.4 | 2,431.3 | 2,529.2 | 2,631.0 | 2,736.9 | 2,847.0 | 2,961.6 |
| Revenue Growth, % | 0 | 2.87 | -0.20091 | 6.06 | 7.37 | 4.03 | 4.03 | 4.03 | 4.03 | 4.03 |
| EBITDA | 454.9 | 411.2 | 393.4 | 414.3 | 464.3 | 490.3 | 510.0 | 530.5 | 551.9 | 574.1 |
| EBITDA, % | 21.88 | 19.22 | 18.43 | 18.3 | 19.1 | 19.38 | 19.38 | 19.38 | 19.38 | 19.38 |
| Depreciation | 56.6 | 59.1 | 59.2 | 60.9 | 63.0 | 68.5 | 71.2 | 74.1 | 77.1 | 80.2 |
| Depreciation, % | 2.72 | 2.76 | 2.77 | 2.69 | 2.59 | 2.71 | 2.71 | 2.71 | 2.71 | 2.71 |
| EBIT | 398.3 | 352.2 | 334.3 | 353.5 | 401.2 | 421.8 | 438.8 | 456.4 | 474.8 | 493.9 |
| EBIT, % | 19.16 | 16.46 | 15.66 | 15.61 | 16.5 | 16.68 | 16.68 | 16.68 | 16.68 | 16.68 |
| Total Cash | 162.7 | 32.9 | 74.1 | 264.0 | 178.4 | 161.0 | 167.5 | 174.2 | 181.2 | 188.5 |
| Total Cash, percent | .0 | .0 | .0 | .0 | .0 | .0 | .0 | .0 | .0 | .0 |
| Account Receivables | 126.9 | 137.2 | 139.4 | 181.5 | 171.2 | 172.5 | 179.4 | 186.7 | 194.2 | 202.0 |
| Account Receivables, % | 6.1 | 6.41 | 6.53 | 8.02 | 7.04 | 6.82 | 6.82 | 6.82 | 6.82 | 6.82 |
| Inventories | 7.1 | 10.1 | 10.3 | 12.0 | 8.2 | 10.9 | 11.4 | 11.8 | 12.3 | 12.8 |
| Inventories, % | 0.34117 | 0.47255 | 0.48113 | 0.53011 | 0.33698 | 0.43239 | 0.43239 | 0.43239 | 0.43239 | 0.43239 |
| Accounts Payable | 54.2 | 73.0 | 41.9 | 64.0 | 44.1 | 63.9 | 66.4 | 69.1 | 71.9 | 74.8 |
| Accounts Payable, % | 2.61 | 3.41 | 1.96 | 2.83 | 1.82 | 2.53 | 2.53 | 2.53 | 2.53 | 2.53 |
| Capital Expenditure | -58.8 | -58.7 | -57.3 | -56.9 | -49.5 | -64.8 | -67.4 | -70.1 | -72.9 | -75.8 |
| Capital Expenditure, % | -2.83 | -2.74 | -2.69 | -2.51 | -2.04 | -2.56 | -2.56 | -2.56 | -2.56 | -2.56 |
| Tax Rate, % | 24.4 | 24.4 | 24.4 | 24.4 | 24.4 | 24.4 | 24.4 | 24.4 | 24.4 | 24.4 |
| EBITAT | 321.4 | 270.0 | 253.1 | 274.9 | 303.3 | 326.0 | 339.1 | 352.8 | 367.0 | 381.7 |
| Depreciation | ||||||||||
| Changes in Account Receivables | ||||||||||
| Changes in Inventories | ||||||||||
| Changes in Accounts Payable | ||||||||||
| Capital Expenditure | ||||||||||
| UFCF | 239.4 | 275.8 | 221.4 | 257.3 | 311.1 | 345.3 | 338.1 | 351.8 | 365.9 | 380.6 |
| WACC, % | 5.87 | 5.87 | 5.87 | 5.87 | 5.87 | 5.87 | 5.87 | 5.87 | 5.87 | 5.87 |
| PV UFCF | ||||||||||
| SUM PV UFCF | 1,501.7 | |||||||||
| Long Term Growth Rate, % | 3.00 | |||||||||
| Free cash flow (T + 1) | 392 | |||||||||
| Terminal Value | 13,654 | |||||||||
| Present Terminal Value | 10,265 | |||||||||
| Enterprise Value | 11,767 | |||||||||
| Net Debt | -38 | |||||||||
| Equity Value | 11,805 | |||||||||
| Diluted Shares Outstanding, MM | 15 | |||||||||
| Equity Value Per Share | 777.34 |
What You Will Get
- Pre-Filled Financial Model: Chemed Corporation’s actual data enables precise DCF valuation.
- Full Forecast Control: Adjust revenue growth, margins, WACC, and other key drivers.
- Instant Calculations: Automatic updates ensure you see results as you make changes.
- Investor-Ready Template: A refined Excel file designed for professional-grade valuation.
- Customizable and Reusable: Tailored for flexibility, allowing repeated use for detailed forecasts.
Key Features
- Comprehensive DCF Calculator: Features detailed unlevered and levered DCF valuation models tailored for Chemed Corporation (CHE).
- WACC Calculator: Pre-configured Weighted Average Cost of Capital sheet with adjustable inputs specific to Chemed Corporation (CHE).
- Customizable Forecast Assumptions: Adjust growth rates, capital expenditures, and discount rates to suit Chemed Corporation (CHE).
- Integrated Financial Ratios: Evaluate profitability, leverage, and efficiency ratios relevant to Chemed Corporation (CHE).
- Visual Dashboard and Charts: Graphical representations summarize essential valuation metrics for straightforward analysis of Chemed Corporation (CHE).
How It Works
- Download: Get the pre-formatted Excel file containing Chemed Corporation's (CHE) financial data.
- Customize: Tailor your forecasts, such as revenue growth, EBITDA %, and WACC.
- Update Automatically: Watch as the intrinsic value and NPV calculations refresh in real-time.
- Test Scenarios: Generate various projections and compare results instantly.
- Make Decisions: Leverage the valuation outcomes to inform your investment strategy.
Why Choose This Calculator for Chemed Corporation (CHE)?
- Designed for Experts: A sophisticated tool utilized by financial analysts, CFOs, and consultants.
- Accurate Financial Data: Chemed’s historical and forecasted financials are preloaded for precision.
- Comprehensive Scenario Analysis: Easily simulate various forecasts and assumptions.
- Insightful Outputs: Automatically computes intrinsic value, NPV, and essential metrics.
- User-Friendly Interface: Step-by-step guidance simplifies the entire process.
Who Should Use This Product?
- Finance Students: Explore valuation methodologies and practice with real-time data on Chemed Corporation (CHE).
- Academics: Integrate industry-standard models into your teaching or research involving Chemed Corporation (CHE).
- Investors: Validate your investment strategies and evaluate valuation results for Chemed Corporation (CHE).
- Analysts: Enhance your analysis process with a ready-to-use, customizable DCF model focused on Chemed Corporation (CHE).
- Small Business Owners: Understand the valuation techniques applied to large public companies like Chemed Corporation (CHE).
What the Template Contains
- Pre-Filled Data: Contains Chemed Corporation’s historical financials and projections.
- Discounted Cash Flow Model: Editable DCF valuation model with automated calculations.
- Weighted Average Cost of Capital (WACC): A dedicated sheet for calculating WACC using custom inputs.
- Key Financial Ratios: Evaluate Chemed Corporation’s profitability, efficiency, and leverage.
- Customizable Inputs: Adjust revenue growth, margins, and tax rates effortlessly.
- Clear Dashboard: Visuals and tables summarizing key valuation outcomes.
Disclaimer
All information, articles, and product details provided on this website are for general informational and educational purposes only. We do not claim any ownership over, nor do we intend to infringe upon, any trademarks, copyrights, logos, brand names, or other intellectual property mentioned or depicted on this site. Such intellectual property remains the property of its respective owners, and any references here are made solely for identification or informational purposes, without implying any affiliation, endorsement, or partnership.
We make no representations or warranties, express or implied, regarding the accuracy, completeness, or suitability of any content or products presented. Nothing on this website should be construed as legal, tax, investment, financial, medical, or other professional advice. In addition, no part of this site—including articles or product references—constitutes a solicitation, recommendation, endorsement, advertisement, or offer to buy or sell any securities, franchises, or other financial instruments, particularly in jurisdictions where such activity would be unlawful.
All content is of a general nature and may not address the specific circumstances of any individual or entity. It is not a substitute for professional advice or services. Any actions you take based on the information provided here are strictly at your own risk. You accept full responsibility for any decisions or outcomes arising from your use of this website and agree to release us from any liability in connection with your use of, or reliance upon, the content or products found herein.