
|
Coursera, Inc. (Cour) Évaluation DCF |
Entièrement Modifiable: Adapté À Vos Besoins Dans Excel Ou Sheets
Conception Professionnelle: Modèles Fiables Et Conformes Aux Normes Du Secteur
Pré-Construits Pour Une Utilisation Rapide Et Efficace
Compatible MAC/PC, entièrement débloqué
Aucune Expertise N'Est Requise; Facile À Suivre
Coursera, Inc. (COUR) Bundle
Conçu pour la précision, notre calculatrice DCF Coursera, Inc. (Cour) vous permet d'évaluer l'évaluation de Coursera en utilisant des informations financières réelles tout en offrant une flexibilité complète pour modifier tous les paramètres essentiels pour des projections améliorées.
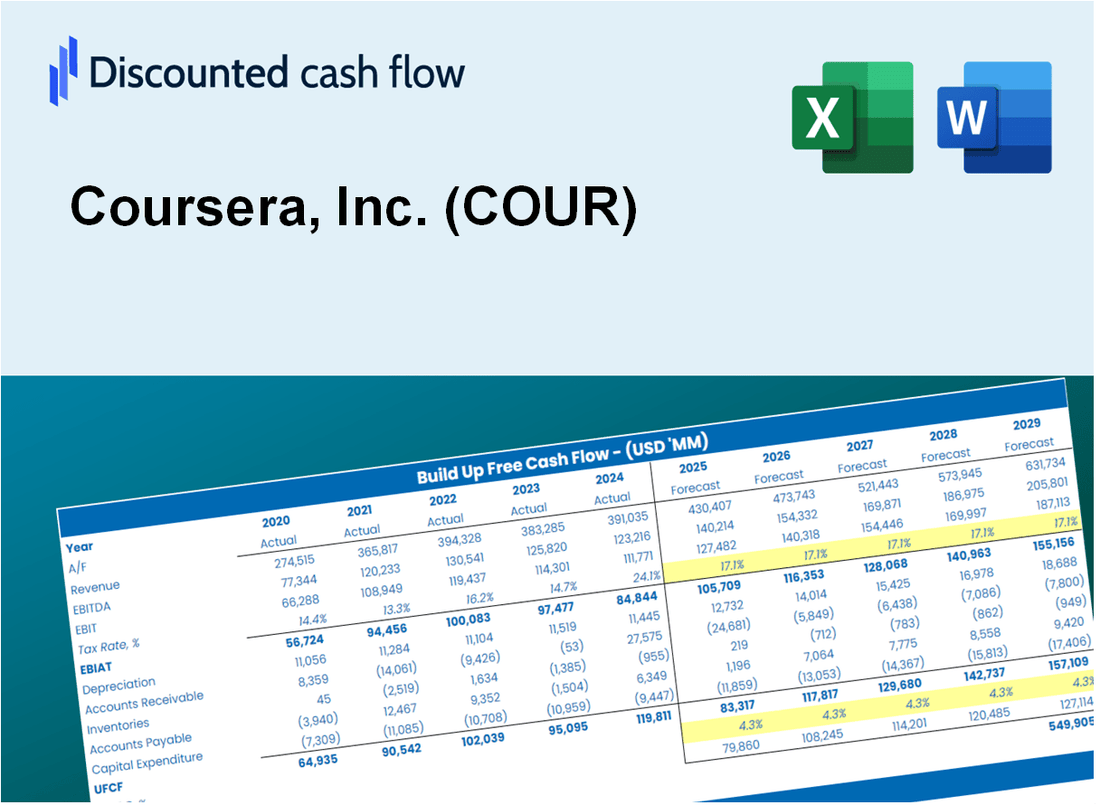
Discounted Cash Flow (DCF) - (USD MM)
| Year | AY1 2020 |
AY2 2021 |
AY3 2022 |
AY4 2023 |
AY5 2024 |
FY1 2025 |
FY2 2026 |
FY3 2027 |
FY4 2028 |
FY5 2029 |
|---|---|---|---|---|---|---|---|---|---|---|
| Revenue | 293.5 | 415.3 | 523.8 | 635.8 | 694.7 | 865.3 | 1,077.9 | 1,342.7 | 1,672.5 | 2,083.3 |
| Revenue Growth, % | 0 | 41.49 | 26.12 | 21.39 | 9.27 | 24.57 | 24.57 | 24.57 | 24.57 | 24.57 |
| EBITDA | -55.7 | -128.3 | -152.1 | -129.1 | -79.2 | -191.5 | -238.5 | -297.1 | -370.1 | -461.0 |
| EBITDA, % | -18.98 | -30.9 | -29.05 | -20.31 | -11.4 | -22.13 | -22.13 | -22.13 | -22.13 | -22.13 |
| Depreciation | 9.6 | 14.8 | 18.5 | 22.3 | 25.1 | 30.2 | 37.7 | 46.9 | 58.4 | 72.8 |
| Depreciation, % | 3.27 | 3.55 | 3.53 | 3.5 | 3.61 | 3.49 | 3.49 | 3.49 | 3.49 | 3.49 |
| EBIT | -65.3 | -143.1 | -170.6 | -151.4 | -104.3 | -221.7 | -276.2 | -344.0 | -428.5 | -533.8 |
| EBIT, % | -22.24 | -34.46 | -32.58 | -23.81 | -15.01 | -25.62 | -25.62 | -25.62 | -25.62 | -25.62 |
| Total Cash | 285.3 | 821.8 | 780.5 | 722.1 | 726.1 | 860.5 | 1,071.8 | 1,335.1 | 1,663.1 | 2,071.7 |
| Total Cash, percent | .0 | .0 | .0 | .0 | .0 | .0 | .0 | .0 | .0 | .0 |
| Account Receivables | 40.7 | 34.4 | 53.7 | 67.4 | 59.7 | 89.3 | 111.3 | 138.6 | 172.6 | 215.0 |
| Account Receivables, % | 13.87 | 8.28 | 10.26 | 10.6 | 8.59 | 10.32 | 10.32 | 10.32 | 10.32 | 10.32 |
| Inventories | .0 | .0 | .0 | .0 | .0 | .0 | .0 | .0 | .0 | .0 |
| Inventories, % | 0 | 0 | 0 | 0 | 0 | 0 | 0 | 0 | 0 | 0 |
| Accounts Payable | 51.9 | 23.3 | 23.3 | 101.0 | 101.9 | 100.9 | 125.7 | 156.5 | 195.0 | 242.9 |
| Accounts Payable, % | 17.68 | 5.6 | 4.46 | 15.89 | 14.66 | 11.66 | 11.66 | 11.66 | 11.66 | 11.66 |
| Capital Expenditure | -11.9 | -13.6 | -13.9 | -16.4 | -1.6 | -22.2 | -27.6 | -34.4 | -42.8 | -53.3 |
| Capital Expenditure, % | -4.06 | -3.29 | -2.65 | -2.58 | -0.22816 | -2.56 | -2.56 | -2.56 | -2.56 | -2.56 |
| Tax Rate, % | -1.31 | -1.31 | -1.31 | -1.31 | -1.31 | -1.31 | -1.31 | -1.31 | -1.31 | -1.31 |
| EBITAT | -66.8 | -145.2 | -175.4 | -158.7 | -105.6 | -221.7 | -276.2 | -344.0 | -428.5 | -533.8 |
| Depreciation | ||||||||||
| Changes in Account Receivables | ||||||||||
| Changes in Inventories | ||||||||||
| Changes in Accounts Payable | ||||||||||
| Capital Expenditure | ||||||||||
| UFCF | -58.0 | -166.4 | -190.0 | -88.8 | -73.6 | -244.2 | -263.3 | -327.9 | -408.5 | -508.9 |
| WACC, % | 10.21 | 10.21 | 10.21 | 10.21 | 10.21 | 10.21 | 10.21 | 10.21 | 10.21 | 10.21 |
| PV UFCF | ||||||||||
| SUM PV UFCF | -1,273.4 | |||||||||
| Long Term Growth Rate, % | 2.00 | |||||||||
| Free cash flow (T + 1) | -519 | |||||||||
| Terminal Value | -6,325 | |||||||||
| Present Terminal Value | -3,891 | |||||||||
| Enterprise Value | -5,164 | |||||||||
| Net Debt | -723 | |||||||||
| Equity Value | -4,441 | |||||||||
| Diluted Shares Outstanding, MM | 157 | |||||||||
| Equity Value Per Share | -28.22 |
What You Will Get
- Comprehensive COUR Financial Data: Pre-filled with Coursera’s historical and projected data for detailed analysis.
- Customizable Template: Easily adjust key inputs like course revenue growth, customer acquisition costs, and retention rates.
- Instant Calculations: Watch Coursera’s intrinsic value update in real-time as you modify inputs.
- Professional Valuation Tool: Tailored for investors, analysts, and consultants aiming for precise DCF outcomes.
- User-Friendly Interface: Intuitive layout and clear guidance suitable for all levels of expertise.
Key Features
- Comprehensive Course Catalog: Access a vast selection of courses from top universities and organizations.
- Flexible Learning Paths: Customize your learning experience with self-paced and instructor-led options.
- Interactive Learning Tools: Engage with quizzes, assignments, and peer reviews to enhance understanding.
- Certifications and Degrees: Earn recognized credentials that can boost your career prospects.
- Accessible for All Levels: Designed for learners ranging from beginners to advanced professionals.
How It Works
- Step 1: Download the Excel file.
- Step 2: Review Coursera’s pre-filled financial data and forecasts.
- Step 3: Modify key inputs such as enrollment growth, WACC, and tax rates (highlighted cells).
- Step 4: Observe the DCF model update in real-time as you adjust your assumptions.
- Step 5: Evaluate the outputs and leverage the results for investment decisions.
Why Choose Coursera, Inc. (COUR)?
- Access to Quality Education: Learn from top universities and institutions worldwide.
- Diverse Course Offerings: Explore a wide range of subjects and skill levels to suit your interests.
- Flexible Learning: Study at your own pace with on-demand courses available anytime.
- Expert Instructors: Gain insights from industry leaders and experienced educators.
- Certification Opportunities: Earn recognized credentials to enhance your career prospects.
Who Should Use This Product?
- Educators and Instructors: Enhance course offerings with up-to-date online learning resources.
- Corporate Training Managers: Implement flexible learning solutions to upskill employees effectively.
- Students: Access a wide range of courses to expand knowledge and improve career prospects.
- Job Seekers: Gain new skills and certifications to stand out in a competitive job market.
- Lifelong Learners: Explore diverse subjects and pursue personal interests through online education.
What the Template Contains
- Historical Data: Includes Coursera’s past financials and baseline forecasts.
- DCF and Levered DCF Models: Detailed templates to calculate Coursera’s intrinsic value.
- WACC Sheet: Pre-built calculations for Weighted Average Cost of Capital.
- Editable Inputs: Modify key drivers like growth rates, EBITDA %, and CAPEX assumptions.
- Quarterly and Annual Statements: A complete breakdown of Coursera’s financials.
- Interactive Dashboard: Visualize valuation results and projections dynamically.
Disclaimer
All information, articles, and product details provided on this website are for general informational and educational purposes only. We do not claim any ownership over, nor do we intend to infringe upon, any trademarks, copyrights, logos, brand names, or other intellectual property mentioned or depicted on this site. Such intellectual property remains the property of its respective owners, and any references here are made solely for identification or informational purposes, without implying any affiliation, endorsement, or partnership.
We make no representations or warranties, express or implied, regarding the accuracy, completeness, or suitability of any content or products presented. Nothing on this website should be construed as legal, tax, investment, financial, medical, or other professional advice. In addition, no part of this site—including articles or product references—constitutes a solicitation, recommendation, endorsement, advertisement, or offer to buy or sell any securities, franchises, or other financial instruments, particularly in jurisdictions where such activity would be unlawful.
All content is of a general nature and may not address the specific circumstances of any individual or entity. It is not a substitute for professional advice or services. Any actions you take based on the information provided here are strictly at your own risk. You accept full responsibility for any decisions or outcomes arising from your use of this website and agree to release us from any liability in connection with your use of, or reliance upon, the content or products found herein.