
|
Cyberark Software Ltd. (CYBR) Valation DCF |
Entièrement Modifiable: Adapté À Vos Besoins Dans Excel Ou Sheets
Conception Professionnelle: Modèles Fiables Et Conformes Aux Normes Du Secteur
Pré-Construits Pour Une Utilisation Rapide Et Efficace
Compatible MAC/PC, entièrement débloqué
Aucune Expertise N'Est Requise; Facile À Suivre
CyberArk Software Ltd. (CYBR) Bundle
Optimisez votre temps et améliorez la précision avec notre calculatrice (CYBR) DCF! En utilisant des données réelles de Cyberark Software Ltd. et des hypothèses personnalisables, cet outil vous permet de prévoir, d'analyser et de valoriser Cyberark comme un investisseur chevronné.
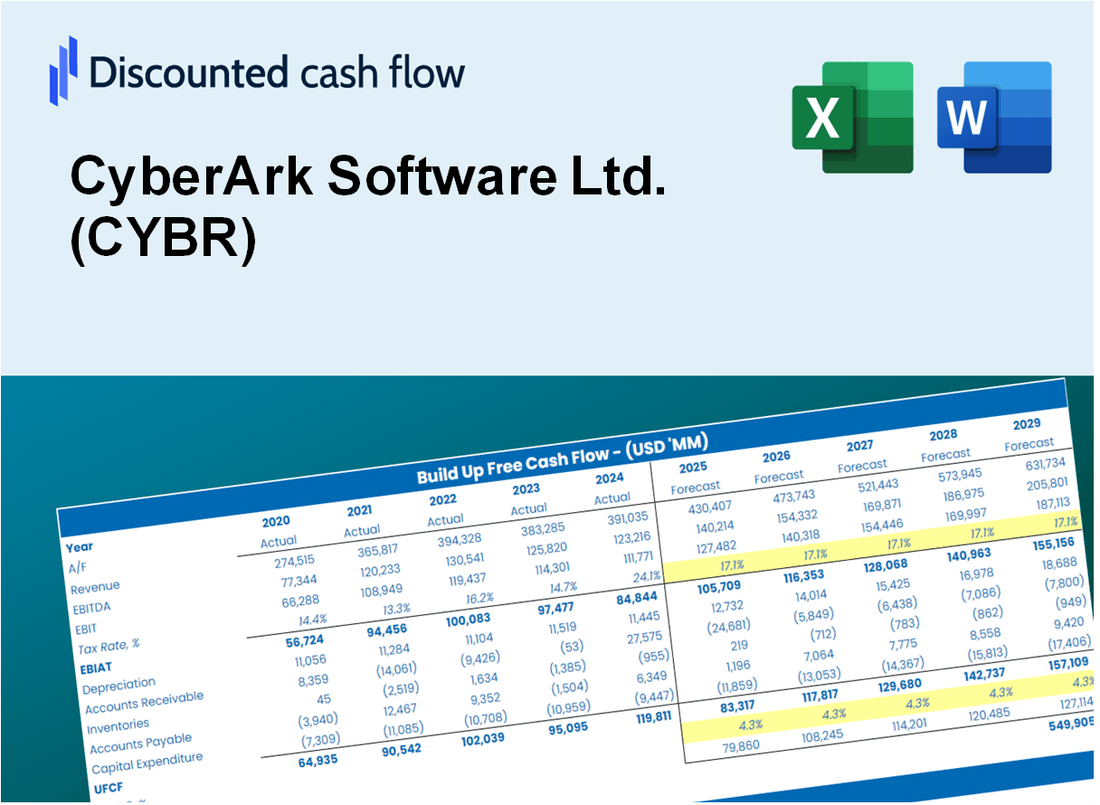
Discounted Cash Flow (DCF) - (USD MM)
| Year | AY1 2020 |
AY2 2021 |
AY3 2022 |
AY4 2023 |
AY5 2024 |
FY1 2025 |
FY2 2026 |
FY3 2027 |
FY4 2028 |
FY5 2029 |
|---|---|---|---|---|---|---|---|---|---|---|
| Revenue | 464.4 | 502.9 | 591.7 | 751.9 | 1,000.7 | 1,216.2 | 1,478.0 | 1,796.2 | 2,182.8 | 2,652.7 |
| Revenue Growth, % | 0 | 8.29 | 17.66 | 27.07 | 33.1 | 21.53 | 21.53 | 21.53 | 21.53 | 21.53 |
| EBITDA | 32.3 | -59.1 | -117.6 | -43.8 | 28.7 | -67.2 | -81.6 | -99.2 | -120.6 | -146.5 |
| EBITDA, % | 6.95 | -11.74 | -19.87 | -5.82 | 2.87 | -5.52 | -5.52 | -5.52 | -5.52 | -5.52 |
| Depreciation | 15.5 | 14.2 | 16.2 | 17.2 | 42.0 | 37.4 | 45.5 | 55.2 | 67.1 | 81.6 |
| Depreciation, % | 3.33 | 2.83 | 2.74 | 2.29 | 4.2 | 3.08 | 3.08 | 3.08 | 3.08 | 3.08 |
| EBIT | 16.8 | -73.3 | -133.8 | -61.0 | -13.3 | -104.6 | -127.1 | -154.5 | -187.7 | -228.1 |
| EBIT, % | 3.62 | -14.57 | -22.61 | -8.11 | -1.33 | -8.6 | -8.6 | -8.6 | -8.6 | -8.6 |
| Total Cash | 953.0 | 926.4 | 954.3 | 993.4 | 819.8 | 1,172.2 | 1,424.5 | 1,731.2 | 2,103.9 | 2,556.8 |
| Total Cash, percent | .0 | .0 | .0 | .0 | .0 | .0 | .0 | .0 | .0 | .0 |
| Account Receivables | 93.1 | 113.2 | 120.8 | 186.5 | 328.5 | 293.4 | 356.5 | 433.2 | 526.5 | 639.9 |
| Account Receivables, % | 20.05 | 22.51 | 20.42 | 24.8 | 32.82 | 24.12 | 24.12 | 24.12 | 24.12 | 24.12 |
| Inventories | .0 | .0 | .0 | .0 | .0 | .0 | .0 | .0 | .0 | .0 |
| Inventories, % | 0 | 0 | 0 | 0 | 0 | 0 | 0 | 0 | 0 | 0 |
| Accounts Payable | 8.3 | 10.1 | 13.6 | 11.0 | 23.7 | 24.1 | 29.3 | 35.6 | 43.3 | 52.6 |
| Accounts Payable, % | 1.78 | 2 | 2.31 | 1.46 | 2.37 | 1.98 | 1.98 | 1.98 | 1.98 | 1.98 |
| Capital Expenditure | -7.2 | -8.9 | -12.5 | -4.9 | -11.1 | -17.5 | -21.3 | -25.9 | -31.4 | -38.2 |
| Capital Expenditure, % | -1.54 | -1.78 | -2.12 | -0.65808 | -1.11 | -1.44 | -1.44 | -1.44 | -1.44 | -1.44 |
| Tax Rate, % | -485.38 | -485.38 | -485.38 | -485.38 | -485.38 | -485.38 | -485.38 | -485.38 | -485.38 | -485.38 |
| EBITAT | 248.6 | -67.4 | -127.3 | -64.1 | -77.9 | -101.9 | -123.8 | -150.5 | -182.9 | -222.2 |
| Depreciation | ||||||||||
| Changes in Account Receivables | ||||||||||
| Changes in Inventories | ||||||||||
| Changes in Accounts Payable | ||||||||||
| Capital Expenditure | ||||||||||
| UFCF | 172.0 | -80.3 | -127.6 | -120.2 | -176.3 | -46.4 | -157.6 | -191.5 | -232.8 | -282.9 |
| WACC, % | 8.37 | 8.37 | 8.37 | 8.37 | 8.37 | 8.37 | 8.37 | 8.37 | 8.37 | 8.37 |
| PV UFCF | ||||||||||
| SUM PV UFCF | -685.5 | |||||||||
| Long Term Growth Rate, % | 2.00 | |||||||||
| Free cash flow (T + 1) | -289 | |||||||||
| Terminal Value | -4,527 | |||||||||
| Present Terminal Value | -3,029 | |||||||||
| Enterprise Value | -3,714 | |||||||||
| Net Debt | -497 | |||||||||
| Equity Value | -3,217 | |||||||||
| Diluted Shares Outstanding, MM | 44 | |||||||||
| Equity Value Per Share | -72.81 |
What You Will Receive
- Customizable Excel Template: A fully adjustable Excel-based DCF Calculator featuring pre-filled real CYBR financials.
- Actual Data Insights: Historical performance data and forward-looking projections (highlighted in the yellow cells).
- Flexible Forecasting: Modify forecast parameters such as revenue growth, EBITDA %, and WACC.
- Instant Calculations: Quickly assess the effect of your inputs on CyberArk’s valuation.
- Professional Resource: Designed for investors, CFOs, consultants, and financial analysts.
- Intuitive Layout: Organized for clarity and simplicity, complete with step-by-step guidance.
Key Features
- Comprehensive Data: CyberArk's historical financial statements and pre-filled projections.
- Customizable Variables: Adjust inputs for WACC, tax rates, revenue growth, and EBITDA margins.
- Real-Time Insights: Monitor CyberArk's intrinsic value recalculating instantly.
- Intuitive Visualizations: Dashboard charts illustrate valuation results and essential metrics.
- Designed for Precision: A professional-grade tool for analysts, investors, and finance professionals.
How It Works
- Step 1: Download the Excel file.
- Step 2: Review CyberArk's pre-filled financial data and forecasts.
- Step 3: Modify critical inputs like revenue growth, WACC, and tax rates (highlighted cells).
- Step 4: Watch the DCF model update instantly as you tweak assumptions.
- Step 5: Analyze the outputs and use the results for investment decisions.
Why Choose CyberArk Software Ltd. (CYBR)?
- Enhance Security: Protect your sensitive data with advanced identity security solutions.
- Boost Efficiency: Streamlined processes minimize the risk of human error in security management.
- Scalable Solutions: Adapt the platform to meet the evolving needs of your organization.
- User-Friendly Interface: Intuitive design ensures easy navigation and quick implementation.
- Backed by Experts: Trusted by industry leaders for its reliability and effectiveness in cybersecurity.
Who Should Use This Product?
- Investors: Accurately assess CyberArk Software Ltd.'s (CYBR) fair value before making investment choices.
- CFOs: Utilize a high-quality DCF model for financial reporting and analysis related to CyberArk (CYBR).
- Consultants: Efficiently customize the template for valuation reports tailored to CyberArk (CYBR) clients.
- Entrepreneurs: Acquire knowledge about financial modeling practices used by leading cybersecurity firms like CyberArk (CYBR).
- Educators: Employ it as a teaching resource to illustrate valuation techniques relevant to CyberArk (CYBR).
What the Template Contains
- Pre-Filled Data: Contains CyberArk’s historical financials and future projections.
- Discounted Cash Flow Model: Editable DCF valuation model with automated calculations.
- Weighted Average Cost of Capital (WACC): A dedicated sheet for WACC calculation based on user-defined inputs.
- Key Financial Ratios: Evaluate CyberArk’s profitability, efficiency, and financial leverage.
- Customizable Inputs: Easily modify revenue growth, profit margins, and tax rates.
- Clear Dashboard: Visual representations including charts and tables summarizing key valuation outcomes.
Disclaimer
All information, articles, and product details provided on this website are for general informational and educational purposes only. We do not claim any ownership over, nor do we intend to infringe upon, any trademarks, copyrights, logos, brand names, or other intellectual property mentioned or depicted on this site. Such intellectual property remains the property of its respective owners, and any references here are made solely for identification or informational purposes, without implying any affiliation, endorsement, or partnership.
We make no representations or warranties, express or implied, regarding the accuracy, completeness, or suitability of any content or products presented. Nothing on this website should be construed as legal, tax, investment, financial, medical, or other professional advice. In addition, no part of this site—including articles or product references—constitutes a solicitation, recommendation, endorsement, advertisement, or offer to buy or sell any securities, franchises, or other financial instruments, particularly in jurisdictions where such activity would be unlawful.
All content is of a general nature and may not address the specific circumstances of any individual or entity. It is not a substitute for professional advice or services. Any actions you take based on the information provided here are strictly at your own risk. You accept full responsibility for any decisions or outcomes arising from your use of this website and agree to release us from any liability in connection with your use of, or reliance upon, the content or products found herein.