
|
Premier Mid Bancshares, Inc. (FMBH) Évaluation DCF |
Entièrement Modifiable: Adapté À Vos Besoins Dans Excel Ou Sheets
Conception Professionnelle: Modèles Fiables Et Conformes Aux Normes Du Secteur
Pré-Construits Pour Une Utilisation Rapide Et Efficace
Compatible MAC/PC, entièrement débloqué
Aucune Expertise N'Est Requise; Facile À Suivre
First Mid Bancshares, Inc. (FMBH) Bundle
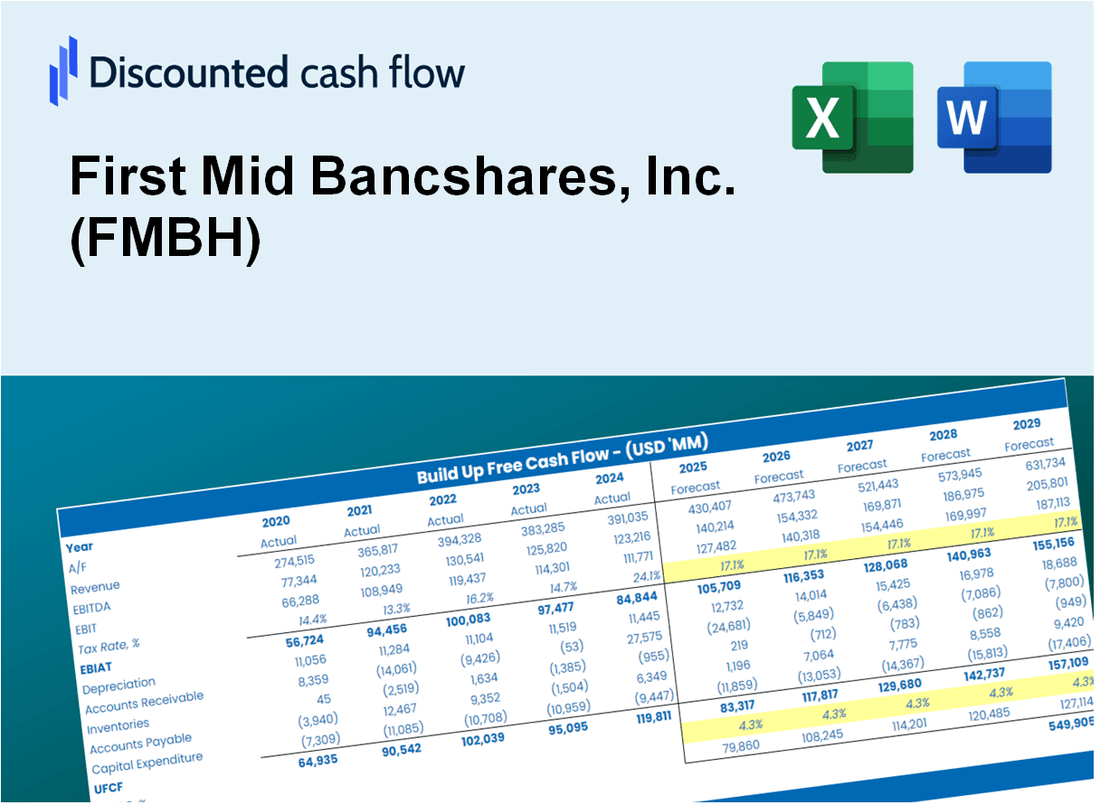
Explorez le potentiel financier de First Mid Bancshares, Inc. (FMBH) avec notre calculatrice DCF conviviale! Entrez vos projections pour la croissance, les marges et les dépenses pour calculer la valeur intrinsèque du premier Mid Bancshares, Inc. (FMBH) et améliorez vos décisions d'investissement.
What You Will Get
- Real FMBH Financials: Access to historical and projected data for precise valuation.
- Customizable Inputs: Adjust WACC, tax rates, revenue growth, and capital expenditures as needed.
- Dynamic Calculations: Intrinsic value and NPV are automatically computed.
- Scenario Analysis: Explore various scenarios to assess First Mid Bancshares' future performance.
- User-Friendly Design: Crafted for professionals but easy to navigate for newcomers.
Key Features
- Comprehensive Financial Data: First Mid Bancshares, Inc.'s (FMBH) historical financial statements and pre-filled projections.
- Customizable Parameters: Modify WACC, tax rates, revenue growth, and net interest margins.
- Real-Time Analysis: View First Mid Bancshares, Inc.'s (FMBH) intrinsic value recalculated instantly.
- Intuitive Visualizations: Dashboard graphs showcase valuation outcomes and essential metrics.
- Designed for Precision: A professional-grade tool for analysts, investors, and finance professionals.
How It Works
- Step 1: Download the Excel file.
- Step 2: Review pre-entered First Mid Bancshares, Inc. (FMBH) data (historical and projected).
- Step 3: Adjust key assumptions (yellow cells) based on your analysis.
- Step 4: View automatic recalculations for First Mid Bancshares, Inc. (FMBH)’s intrinsic value.
- Step 5: Use the outputs for investment decisions or reporting.
Why Choose First Mid Bancshares, Inc. (FMBH)?
- Time Efficiency: Access ready-to-use financial tools without the hassle of starting from scratch.
- Enhanced Precision: Utilize dependable financial metrics and calculations to minimize valuation errors.
- Customizable Solutions: Adjust the tools to align with your unique financial assumptions and forecasts.
- User-Friendly Insights: Intuitive charts and outputs simplify the interpretation of results.
- Preferred by Professionals: Crafted for industry experts who prioritize accuracy and functionality.
Who Should Use This Product?
- Investors: Evaluate First Mid Bancshares, Inc.'s (FMBH) performance before making investment decisions.
- CFOs and Financial Analysts: Enhance valuation methodologies and assess financial forecasts for FMBH.
- Startup Founders: Discover the valuation strategies applied to established financial institutions like First Mid Bancshares, Inc. (FMBH).
- Consultants: Provide detailed valuation analyses and reports for clients interested in FMBH.
- Students and Educators: Utilize current market data to teach and learn about financial valuation practices using FMBH as a case study.
What the Template Contains
- Pre-Filled Data: Includes First Mid Bancshares, Inc.'s (FMBH) historical financials and forecasts.
- Discounted Cash Flow Model: Editable DCF valuation model with automatic calculations tailored for (FMBH).
- Weighted Average Cost of Capital (WACC): A dedicated sheet for calculating WACC based on custom inputs specific to (FMBH).
- Key Financial Ratios: Analyze (FMBH)'s profitability, efficiency, and leverage metrics.
- Customizable Inputs: Edit revenue growth, margins, and tax rates for (FMBH) with ease.
- Clear Dashboard: Charts and tables summarizing key valuation results for (FMBH).
Disclaimer
All information, articles, and product details provided on this website are for general informational and educational purposes only. We do not claim any ownership over, nor do we intend to infringe upon, any trademarks, copyrights, logos, brand names, or other intellectual property mentioned or depicted on this site. Such intellectual property remains the property of its respective owners, and any references here are made solely for identification or informational purposes, without implying any affiliation, endorsement, or partnership.
We make no representations or warranties, express or implied, regarding the accuracy, completeness, or suitability of any content or products presented. Nothing on this website should be construed as legal, tax, investment, financial, medical, or other professional advice. In addition, no part of this site—including articles or product references—constitutes a solicitation, recommendation, endorsement, advertisement, or offer to buy or sell any securities, franchises, or other financial instruments, particularly in jurisdictions where such activity would be unlawful.
All content is of a general nature and may not address the specific circumstances of any individual or entity. It is not a substitute for professional advice or services. Any actions you take based on the information provided here are strictly at your own risk. You accept full responsibility for any decisions or outcomes arising from your use of this website and agree to release us from any liability in connection with your use of, or reliance upon, the content or products found herein.