
|
Hudson Technologies, Inc. (HDSN): 5 Analyse des forces [Jan-2025 MISE À JOUR] |
Entièrement Modifiable: Adapté À Vos Besoins Dans Excel Ou Sheets
Conception Professionnelle: Modèles Fiables Et Conformes Aux Normes Du Secteur
Pré-Construits Pour Une Utilisation Rapide Et Efficace
Compatible MAC/PC, entièrement débloqué
Aucune Expertise N'Est Requise; Facile À Suivre
Hudson Technologies, Inc. (HDSN) Bundle
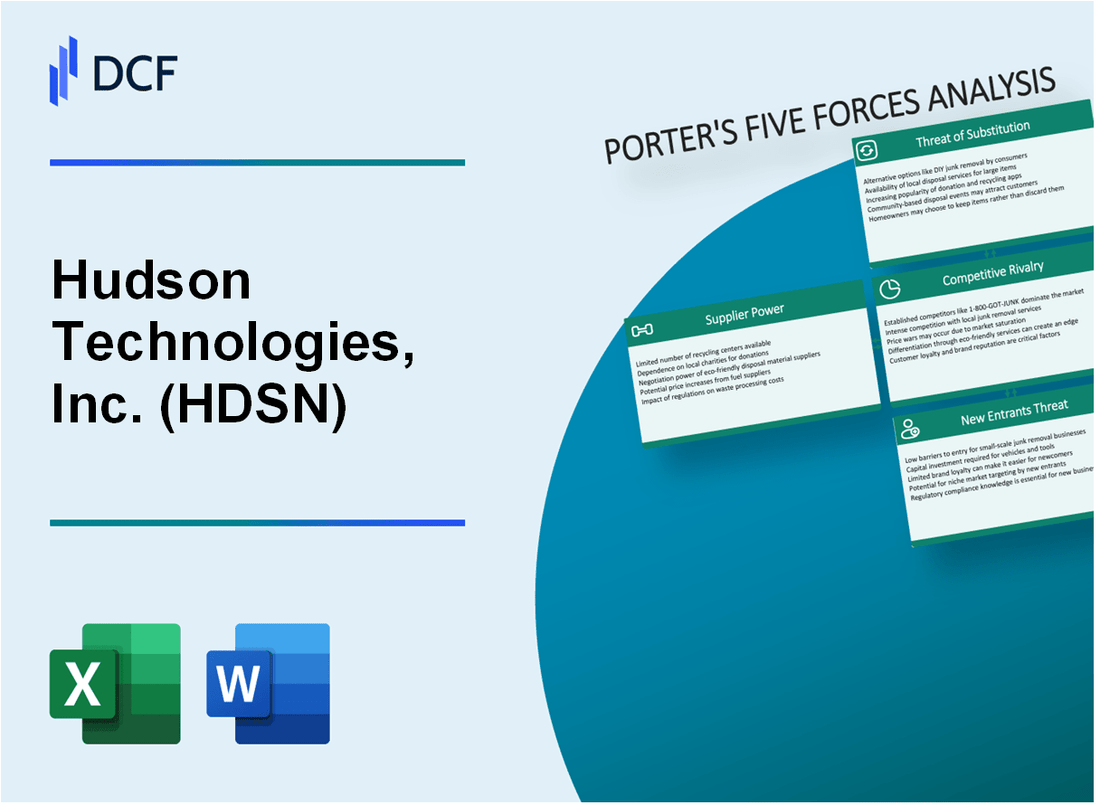
Dans le paysage dynamique des services de refroidissement et environnementaux industriels, Hudson Technologies, Inc. (HDSN) navigue dans un écosystème complexe de forces du marché qui façonnent son positionnement stratégique. En tant qu'acteur clé dans les technologies de remise en état de réfrigérant et de CVC, l'entreprise est confrontée à un environnement compétitif à multiples facettes où les relations avec les fournisseurs, la dynamique des clients, les innovations technologiques et les défis réglementaires se croisent pour définir son potentiel de croissance et de durabilité. Comprendre ces cinq forces complexes de Porter fournit des informations critiques sur la résilience opérationnelle et les opportunités stratégiques d'Hudson Technologies dans le secteur des services industriels en évolution.
Hudson Technologies, Inc. (HDSN) - Porter's Five Forces: Bargaining Power of Fournissers
Nombre limité de fournisseurs de composants de réfrigérant et de CVC spécialisés
En 2024, le marché mondial des réfrigérants se caractérise par un paysage de fournisseur concentré. Environ 3 à 4 grands fabricants dominent la chaîne d'approvisionnement du réfrigérant industriel, notamment Chemours, Honeywell et Arkema.
| Fournisseur | Part de marché | Revenus annuels |
|---|---|---|
| Chimiores | 35.6% | 6,2 milliards de dollars |
| Honeywell | 28.3% | 5,4 milliards de dollars |
| Arkème | 16.7% | 3,1 milliards de dollars |
Chaîne d'approvisionnement concentrée pour les technologies de refroidissement industrielles
La chaîne d'approvisionnement de la technologie de refroidissement industrielle révèle une concentration importante:
- Les 5 meilleurs fabricants de composants HVAC contrôlent 62,4% du marché mondial
- Valeur marchande des composants mondiaux mondiaux estimés: 78,3 milliards de dollars en 2024
- Augmentation moyenne des prix des composants: 4,2% par an
Dépendance potentielle à l'égard des fabricants spécifiques
Hudson Technologies fait face à des dépendances critiques sur les fabricants spécialisés:
| Type de composant | Nombre de fournisseurs | Complexité de remplacement |
|---|---|---|
| Compresseurs de réfrigération avancés | 2-3 fabricants mondiaux | Complexité technique élevée |
| Systèmes de refroidissement spécialisés | 4-5 fabricants mondiaux | Complexité technique modérée |
Coûts de commutation des fournisseurs modérés
Spécifications techniques Impact du fournisseur Commutateur avec les coûts estimés:
- Coûts de recertification des composants moyens: 127 500 $
- Temps de requalification technique: 4 à 6 mois
- Dépenses de commutation totales estimées: 215 000 $ - 345 000 $ par ligne de composants critiques
Hudson Technologies, Inc. (HDSN) - Porter's Five Forces: Bargaining Power of Clients
Analyse de la clientèle concentrée
Depuis le quatrième trimestre 2023, Hudson Technologies dessert environ 87 clients CVC industriels et commerciaux à travers l'Amérique du Nord. La rupture de la concentration des clients de l'entreprise montre:
| Segment de clientèle | Pourcentage de revenus | Nombre de clients |
|---|---|---|
| Grands clients industriels | 62.4% | 34 |
| Clients commerciaux moyens | 27.6% | 42 |
| Petits fournisseurs de services HVAC | 10% | 11 |
Métriques de sensibilité aux prix
La sensibilité aux prix dans les services mécaniques et la gestion des réfrigérants révèle la dynamique critique du marché:
- Élasticité des prix moyenne: -1,3 pour les services de gestion des réfrigérants
- Plage de négociation des prix: 4,7% à 8,2% pour les contrats à long terme
- Pression de tarification compétitive: 6,5% d'une année à l'autre
Paysage du contrat de service
Les détails du contrat avec les principaux clients industriels démontrent un pouvoir de négociation important:
| Type de contrat | Durée moyenne | Valeur du contrat annuel |
|---|---|---|
| Service de CVC complet | 3,2 ans | $487,600 |
| Gestion du réfrigérant | 2,7 ans | $276,300 |
Paysage des prestataires de services compétitifs
L'analyse de la concurrence sur le marché montre:
- Total des fournisseurs de services de gestion de réfrigérant: 43
- Concurrents du marché régional: 12
- Coût moyen de commutation du client: 42 500 $
- Taux de rétention de la clientèle: 78,3%
Hudson Technologies, Inc. (HDSN) - Five Forces de Porter: Rivalité compétitive
Concurrence sur le marché Overview
Depuis 2024, Hudson Technologies opère sur un marché de la récupération de réfrigérant industriel avec environ 12 à 15 concurrents importants à l'échelle nationale.
| Catégorie des concurrents | Nombre de concurrents | Gamme de parts de marché |
|---|---|---|
| Fournisseurs de services nationaux de CVC | 5-7 | 35-45% |
| Entreprises régionales de remise en état de réfrigérant | 7-8 | 25-35% |
Caractéristiques du paysage concurrentiel
Hudson Technologies se différencie grâce à des services de conformité environnementale spécialisés avec les avantages concurrentiels suivants:
- Technologie de remise en état de réfrigérant propriétaire
- Processus de conformité environnementale certifiés EPA
- Capacités technologiques avancées dans la gestion des réfrigérants
Positionnement de la concurrence technologique
Les capacités technologiques d'Hudson Technologies comprennent:
| Métrique technologique | Indicateur de performance |
|---|---|
| Efficacité de remise en état | Taux de récupération de réfrigérant 92-95% |
| Investissement technologique annuel | Dépenses de R&D de 1,2 à 1,5 million de dollars |
Hudson Technologies, Inc. (HDSN) - Five Forces de Porter: Menace de substituts
Des technologies de refroidissement et de réfrigération alternatives émergent
Hudson Technologies fait face à des risques de substitution potentiels des technologies émergentes:
| Technologie | Pénétration du marché (%) | Impact potentiel |
|---|---|---|
| Réfrigération magnétique | 2.3% | Efficacité énergétique élevée |
| Refroidissement thermoélectrique | 1.7% | Contrôle précis de la température |
| Refroidissement liquide d'azote | 0.9% | Applications de température extrêmes |
Intérêt croissant pour les solutions CVC économes en énergie
Les alternatives économes en énergie présentent un défi de marché important:
- Croissance du marché des systèmes de refroidissement solaire: 12,5% par an
- Part de marché de la technologie de la pompe à chaleur: 7,8%
- Taux d'adoption des systèmes de refroidissement géothermique: 3,2%
Perturbations technologiques potentielles dans le secteur des services environnementaux
| Technologie perturbatrice | Investissement ($ m) | Déplacement potentiel du marché |
|---|---|---|
| Optimisation de CVC dirigée AI | 124,6 M $ | 15-20% de réduction des services traditionnels |
| Systèmes de refroidissement de la nanotechnologie | 87,3 millions de dollars | Potentiel du marché de 10 à 12% |
Augmentation des réglementations environnementales stimulant les innovations des services
Paysage réglementaire de conduite du paysage Potentiel:
- Coût de conformité de l'élimination des réfrigérants de l'EPA: 3,2 milliards de dollars à l'échelle de l'industrie
- Normes d'efficacité énergétique Impact: 7,6% Exigence de modification des services
- Mandats de réduction du carbone: 22% plus stricts d'ici 2025
Hudson Technologies, Inc. (HDSN) - Five Forces de Porter: Menace de nouveaux entrants
Exigences de capital initial pour un équipement de CVC spécialisé
Hudson Technologies nécessite environ 2,5 à 4,7 millions de dollars d'investissement en équipement initial pour les systèmes spécialisés de gestion de CVC et de réfrigérant.
| Catégorie d'équipement | Gamme d'investissement estimée |
|---|---|
| Machines de récupération de réfrigérant | $350,000 - $750,000 |
| Équipement de test de diagnostic | $450,000 - $900,000 |
| Outils de diagnostic HVAC spécialisés | $275,000 - $550,000 |
Expertise technique et barrières de certification
L'entrée du marché nécessite des certifications techniques spécifiques avec des exigences strictes:
- Coût de certification de la section 608 de l'EPA: 250 $ - 500 $
- Certification professionnelle HVAC: 1 200 $ - 3 500 $
- Certification avancée de gestion de réfrigérant: 1 800 $ - 4 200 $
Obstacles à la conformité réglementaire
Les coûts de conformité pour les réglementations sur l'industrie des services environnementaux en moyenne 175 000 $ - 425 000 $ par an pour les nouveaux entrants du marché.
| Zone de conformité réglementaire | Gamme de coûts annuelle |
|---|---|
| Conformité à l'agence de protection de l'environnement | $75,000 - $175,000 |
| Règlements environnementaux au niveau de l'État | $50,000 - $125,000 |
| Conformité à la sécurité et à la formation | $50,000 - $125,000 |
Défis d'entrée de la relation client
Hudson Technologies a établi des relations avec 87 clients industriels représentant 42,6 millions de dollars en valeur contractuelle annuelle.
- Durée du contrat moyen: 3-5 ans
- Taux de rétention client typique: 72%
- Coûts de commutation pour les clients industriels: 75 000 $ - 250 000 $
Hudson Technologies, Inc. (HDSN) - Porter's Five Forces: Competitive rivalry
You're looking at the competitive landscape for Hudson Technologies, Inc. (HDSN) right now, and the rivalry piece is definitely interesting. Honestly, the dynamic has shifted quite a bit from last year. Back in 2024, the rivalry with virgin HFC suppliers was intense because of a massive stockpile of imported product that really depressed prices. That inventory overhang meant competition was a pure price war on virgin material, which squeezed margins across the board.
Still, by the time Hudson Technologies reported its third quarter of 2025 results, the story had changed. The company posted Q3 2025 revenue of $74.01 million, showing a strong 19.5% year-over-year growth, which is a clear sign they are outperforming rivals in the current environment. The gross margin for that quarter hit 32.0%, a significant improvement from the 25.7% seen in Q3 2024. This performance suggests the pricing pressure from the 2024 stockpile has eased, letting Hudson's reclaimed product shine.
The structure of the US reclamation market itself defines much of this rivalry. Hudson Technologies is the clear leader, holding about 35% of the entire US reclamation market. But here's the catch: the rest of the industry is highly fragmented. That means Hudson competes against a large number of smaller players, even though it is the only one with a true nationwide reach.
What this means for strategy is that the focus is moving. Competition is no longer just about beating the price of virgin HFCs; it's increasingly about the reliability of the reclaimed supply. Customers need assurance they can get the product they need, especially as HFC phase-down regulations continue. Hudson Technologies is leaning into this by continuing its strategic supply chain expansion and promoting its robust recovery initiatives.
Here's a quick look at how Hudson Technologies' recent performance stacks up against that competitive backdrop:
| Metric | Value | Context |
|---|---|---|
| Q3 2025 Revenue | $74.01 million | Strong performance against rivals. |
| Q3 2025 Gross Margin | 32.0% | Improved significantly from Q3 2024's 25.7%. |
| US Reclamation Market Share | 35% | Largest share in a fragmented industry. |
| 2024 Industry Reclamation Growth | 19% | Indicates overall market demand strength. |
| Cash Position (Sept 30, 2025) | Approx. $89.7 million | Substantial cash position with no debt. |
| DLA Contract Value | $210 million | Five-year base period for supply of refrigerants. |
The shift in competitive focus is best illustrated by the evolving price expectations for key refrigerants, which directly impacts the value proposition of reclaimed versus virgin supply:
- HFC 410A price in Q2 2025 reached $8 per pound.
- Analyst expectation for HFC 410A price in 2026 is $7.00 per pound, down from the prior forecast range of $8.00-$9.00.
- The company's reclamation volume grew at a rate consistent with the industry's 19% growth in 2024.
- HFC inventory levels in the channel declined 18% in 2024, though less steeply than some expected.
The ability of Hudson Technologies to maintain strong margins, like the 32.0% in Q3 2025, while the market digests the remaining 2024 stockpile is key to weathering this rivalry. If onboarding takes 14+ days, churn risk rises, and in this industry, supply reliability is the ultimate differentiator.
Hudson Technologies, Inc. (HDSN) - Porter's Five Forces: Threat of substitutes
You're analyzing the competitive landscape for Hudson Technologies, Inc. (HDSN), and the threat from substitutes is complex, driven by regulatory timelines and the sheer inertia of the installed equipment base. The primary long-term substitute for the Hydrofluorocarbons (HFCs) that Hudson services and reclaims is the next generation of refrigerants, primarily Hydrofluoroolefins (HFOs) and blends like R-32 and R-454B, which have lower Global Warming Potential (GWP). However, adoption for the existing equipment fleet is slow. The American Innovation and Manufacturing (AIM) Act has set the stage for this shift, mandating an 85% phasedown of HFC production and consumption from baseline levels by 2036.
The immediate barrier to switching to these next-generation substitutes is the high capital expenditure required for system replacement or retrofit. For the vast installed base of HFC equipment, which is estimated to be around 125 million units with a useful lifetime exceeding 15 years, the cost to switch is substantial.
| System/Project Type (2025 Estimate) | Cost Range (USD) |
|---|---|
| Residential HVAC System Replacement (Average) | $5,000 to $12,000 |
| Typical 2,000-2,500 sq. ft. Combined System Replacement | Approximately $13,430 to $14,000 |
| Equipment Change-out Only (Reusing Ductwork) | $5,000 to $11,000 |
| Ductwork Replacement (Additional Cost for 2,000 sq. ft. Home) | Adds $2,100 to $4,000 |
This high replacement cost creates a strong economic incentive for owners to maintain their current systems, which directly supports the demand for HFC servicing. This is where reclaimed HFCs become a necessary, temporary substitute for virgin material. As a leading reclaimer, Hudson Technologies is positioned to fill the supply gap created by the mandated reduction in virgin HFC production allowances.
Regulatory mandates under the AIM Act explicitly favor reclamation as a management strategy. Restrictions on the use of higher-GWP HFCs in new refrigeration, air conditioning, and heat pump equipment took effect as early as January 1, 2025. However, the EPA also authorized regulations to maximize reclamation and minimize releases from existing equipment. This regulatory focus on reclamation, rather than immediate, costly substitution, supports the service life of the existing asset base. For instance, in the second quarter of 2025, Hudson observed a sequential increase in refrigerant pricing, with HFC 410A reaching $8 per pound. This pricing environment, coupled with a 31% gross margin in Q2 2025, reflects the value captured in the reclaimed market, which is integral to servicing the long-life installed fleet.
The current situation highlights a reliance on servicing existing assets, which benefits Hudson's core reclamation business. You can see the financial impact in the recent figures:
- Hudson Technologies reported Q2 2025 revenue of $72.8 million.
- Gross margin for Q2 2025 was 31%.
- HFC 410A price sequentially increased to $8 per pound in Q2 2025.
- The installed base of HFC units is approximately 125 million.
Hudson Technologies, Inc. (HDSN) - Porter's Five Forces: Threat of new entrants
The threat of new entrants into the refrigerant reclamation and distribution space where Hudson Technologies, Inc. operates is generally considered low, primarily due to substantial upfront investment requirements and a complex regulatory landscape. For you, as an analyst looking at this industry, these barriers translate directly into a significant moat protecting Hudson Technologies' market position.
High Capital Expenditure for Technology and Network
Entering the reclamation business demands significant capital expenditure for the specialized equipment needed to process used refrigerants to meet purity standards. Refrigerant reclaimers must purchase machinery for testing composition, removing impurities, and altering blends, with higher complexity blends potentially requiring expensive fractional distillation setups. While a precise startup cost for a national network isn't publicly itemized, the equipment itself presents an initial hurdle; basic certified recovery machines can range from $400 up to $3,000 for high-capacity commercial units. Furthermore, establishing a national distribution network requires capital for logistics, storage, and inventory management, which is a massive undertaking to match the scale Hudson Technologies has built.
Significant Regulatory Hurdles and Compliance Costs
The regulatory environment, governed by the Environmental Protection Agency (EPA) and the American Innovation and Manufacturing (AIM) Act, creates a steep learning curve and financial risk for newcomers. Technicians must obtain EPA 608 Certification, with training and exam fees for non-members costing around $240.00 per person, though this is minor compared to the operational risk. The real deterrent is the potential penalty for non-compliance; EPA violations can result in fines ranging from $2,500 to $37,500 per day. A new entrant must immediately invest in robust compliance documentation systems, which can require an initial setup cost of $500 to $1,500 for digital record-keeping, just to operate legally.
Financial Strength as a Deterrent
Hudson Technologies, Inc.'s balance sheet acts as a powerful financial barrier. As of September 30, 2025, the company reported approximately $89.7 million in cash and cash equivalents with no debt. This unlevered position allows Hudson Technologies to absorb market fluctuations, invest aggressively in organic growth, and pursue strategic acquisitions without the immediate pressure of debt servicing. A new entrant, needing to finance both CapEx and working capital, faces a much higher cost of entry and greater financial fragility compared to Hudson's cash-rich standing.
Established Relationships and Scale
Scale and entrenched relationships are incredibly difficult for a smaller, newer reclaimer to replicate. Hudson Technologies' position is cemented by long-term commitments, such as the recently awarded five-year base contract with the U.S. Defense Logistics Agency (DLA), valued at $210 million. This type of massive, recurring government business demonstrates a level of trust, logistical capability, and proven scale that takes years, if not decades, to build. Furthermore, Hudson Technologies is actively working to expand its supply chain through outreach campaigns to contractors, creating a network effect that locks in the supply of used refrigerant-the raw material for reclamation.
The barriers to entry can be summarized by the required investment profile:
| Barrier Component | Quantifiable Metric/Data Point | Source of Barrier |
|---|---|---|
| Financial Firepower | $89.7 million Cash on Hand (Q3 2025) | Ability to fund large CapEx and weather initial operating losses. |
| Regulatory Compliance (Technician) | Up to $500 per technician for training/exam | Mandatory initial cost for workforce to legally handle refrigerants. |
| Regulatory Compliance (Operational Risk) | Fines up to $37,500 per day | High cost of non-compliance with EPA/AIM Act standards. |
| Established Scale/Relationships | $210 million DLA Contract Value (5-year base) | Demonstrates proven capability to service major, long-term government contracts. |
| Reclamation Equipment | Recovery machines up to $3,000 per unit | Required investment in certified technology for processing. |
The practical implications for a potential new entrant are clear:
- Secure multi-million dollar financing before operations start.
- Develop specialized, EPA-compliant processing technology.
- Build a national logistics chain for collection and distribution.
- Secure large, recurring contracts to achieve necessary volume.
- Ensure all field staff possess required EPA 608 certifications.
Finance: draft a sensitivity analysis on the impact of a 10% increase in EPA fine exposure by next Tuesday.
Disclaimer
All information, articles, and product details provided on this website are for general informational and educational purposes only. We do not claim any ownership over, nor do we intend to infringe upon, any trademarks, copyrights, logos, brand names, or other intellectual property mentioned or depicted on this site. Such intellectual property remains the property of its respective owners, and any references here are made solely for identification or informational purposes, without implying any affiliation, endorsement, or partnership.
We make no representations or warranties, express or implied, regarding the accuracy, completeness, or suitability of any content or products presented. Nothing on this website should be construed as legal, tax, investment, financial, medical, or other professional advice. In addition, no part of this site—including articles or product references—constitutes a solicitation, recommendation, endorsement, advertisement, or offer to buy or sell any securities, franchises, or other financial instruments, particularly in jurisdictions where such activity would be unlawful.
All content is of a general nature and may not address the specific circumstances of any individual or entity. It is not a substitute for professional advice or services. Any actions you take based on the information provided here are strictly at your own risk. You accept full responsibility for any decisions or outcomes arising from your use of this website and agree to release us from any liability in connection with your use of, or reliance upon, the content or products found herein.