
|
Lensar, Inc. (LNSR) Évaluation DCF |
Entièrement Modifiable: Adapté À Vos Besoins Dans Excel Ou Sheets
Conception Professionnelle: Modèles Fiables Et Conformes Aux Normes Du Secteur
Pré-Construits Pour Une Utilisation Rapide Et Efficace
Compatible MAC/PC, entièrement débloqué
Aucune Expertise N'Est Requise; Facile À Suivre
LENSAR, Inc. (LNSR) Bundle
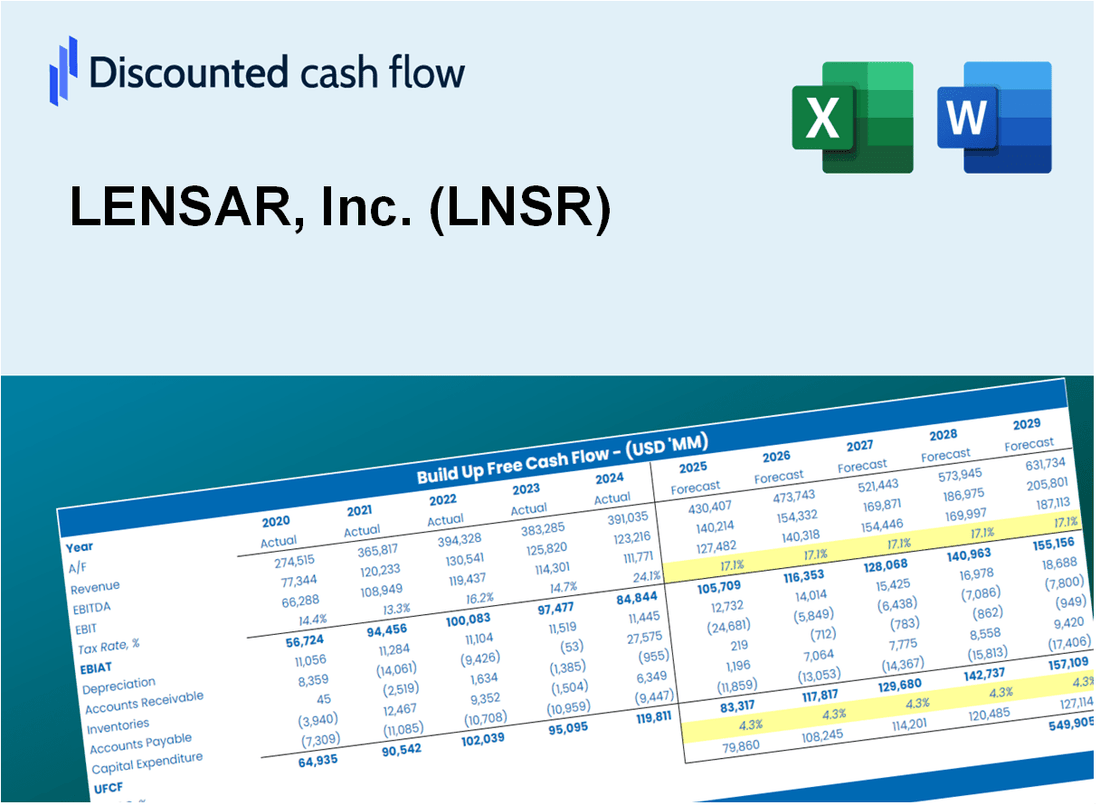
Explorez le potentiel financier de Lensar, Inc. (LNSR) avec notre calculatrice DCF conviviale! Entrez vos projections pour la croissance, les marges et les dépenses pour calculer la valeur intrinsèque de Lensar, Inc. (LNSR) et informer votre stratégie d'investissement.
What You Will Get
- Real LNSR Financials: Access to comprehensive historical and projected data for precise valuation.
- Customizable Inputs: Adjust key parameters such as WACC, tax rates, revenue growth, and capital expenditures.
- Dynamic Calculations: Automatically computes intrinsic value and NPV in real-time.
- Scenario Analysis: Evaluate various scenarios to assess LENSAR, Inc.'s future performance.
- User-Friendly Design: Designed for professionals while remaining approachable for newcomers.
Key Features
- Customizable Performance Metrics: Adjust vital inputs such as revenue projections, gross margin %, and capital investments.
- Instant DCF Valuation: Quickly computes intrinsic value, NPV, and additional financial metrics.
- High Precision Results: Leverages LENSAR's actual financial data for accurate valuation insights.
- Effortless Scenario Testing: Evaluate various assumptions and analyze results with ease.
- Efficiency Booster: Remove the hassle of constructing intricate valuation models from the ground up.
How It Works
- Download the Template: Gain immediate access to the Excel-based LENSAR DCF Calculator.
- Input Your Assumptions: Modify the yellow-highlighted cells for growth rates, WACC, margins, and additional parameters.
- Instant Calculations: The model will automatically refresh LENSAR’s intrinsic value.
- Test Scenarios: Experiment with various assumptions to assess potential valuation shifts.
- Analyze and Decide: Utilize the outcomes to inform your investment or financial analysis.
Why Choose This Calculator for LENSAR, Inc. (LNSR)?
- User-Friendly Interface: Tailored for both novice users and seasoned professionals.
- Customizable Inputs: Adjust parameters easily to suit your specific analysis.
- Real-Time Feedback: Observe immediate changes to LENSAR’s valuation as you modify inputs.
- Preloaded Data: Comes equipped with LENSAR’s latest financial information for swift evaluations.
- Relied Upon by Experts: Favored by investors and analysts for making well-informed choices.
Who Should Use LENSAR, Inc. (LNSR)?
- Healthcare Professionals: Enhance your practice with cutting-edge laser technology for cataract surgery.
- Ophthalmologists: Streamline procedures with advanced tools designed for precision and efficiency.
- Medical Consultants: Customize presentations to demonstrate the benefits of LENSAR's innovative solutions.
- Investors: Gain insights into the ophthalmic market with a company at the forefront of laser technology.
- Students and Educators: Utilize LENSAR's resources to enrich learning in medical and technological fields.
What the Template Contains
- Pre-Filled Data: Includes LENSAR, Inc.'s historical financials and projections.
- Discounted Cash Flow Model: Editable DCF valuation model with automated calculations.
- Weighted Average Cost of Capital (WACC): A dedicated sheet for calculating WACC based on user-defined inputs.
- Key Financial Ratios: Evaluate LENSAR, Inc.'s profitability, efficiency, and leverage metrics.
- Customizable Inputs: Easily modify revenue growth, profit margins, and tax rates.
- Clear Dashboard: Visual representations and tables summarizing essential valuation outcomes.
Disclaimer
All information, articles, and product details provided on this website are for general informational and educational purposes only. We do not claim any ownership over, nor do we intend to infringe upon, any trademarks, copyrights, logos, brand names, or other intellectual property mentioned or depicted on this site. Such intellectual property remains the property of its respective owners, and any references here are made solely for identification or informational purposes, without implying any affiliation, endorsement, or partnership.
We make no representations or warranties, express or implied, regarding the accuracy, completeness, or suitability of any content or products presented. Nothing on this website should be construed as legal, tax, investment, financial, medical, or other professional advice. In addition, no part of this site—including articles or product references—constitutes a solicitation, recommendation, endorsement, advertisement, or offer to buy or sell any securities, franchises, or other financial instruments, particularly in jurisdictions where such activity would be unlawful.
All content is of a general nature and may not address the specific circumstances of any individual or entity. It is not a substitute for professional advice or services. Any actions you take based on the information provided here are strictly at your own risk. You accept full responsibility for any decisions or outcomes arising from your use of this website and agree to release us from any liability in connection with your use of, or reliance upon, the content or products found herein.