
|
Ncino, Inc. (NCNO) Évaluation DCF |
Entièrement Modifiable: Adapté À Vos Besoins Dans Excel Ou Sheets
Conception Professionnelle: Modèles Fiables Et Conformes Aux Normes Du Secteur
Pré-Construits Pour Une Utilisation Rapide Et Efficace
Compatible MAC/PC, entièrement débloqué
Aucune Expertise N'Est Requise; Facile À Suivre
nCino, Inc. (NCNO) Bundle
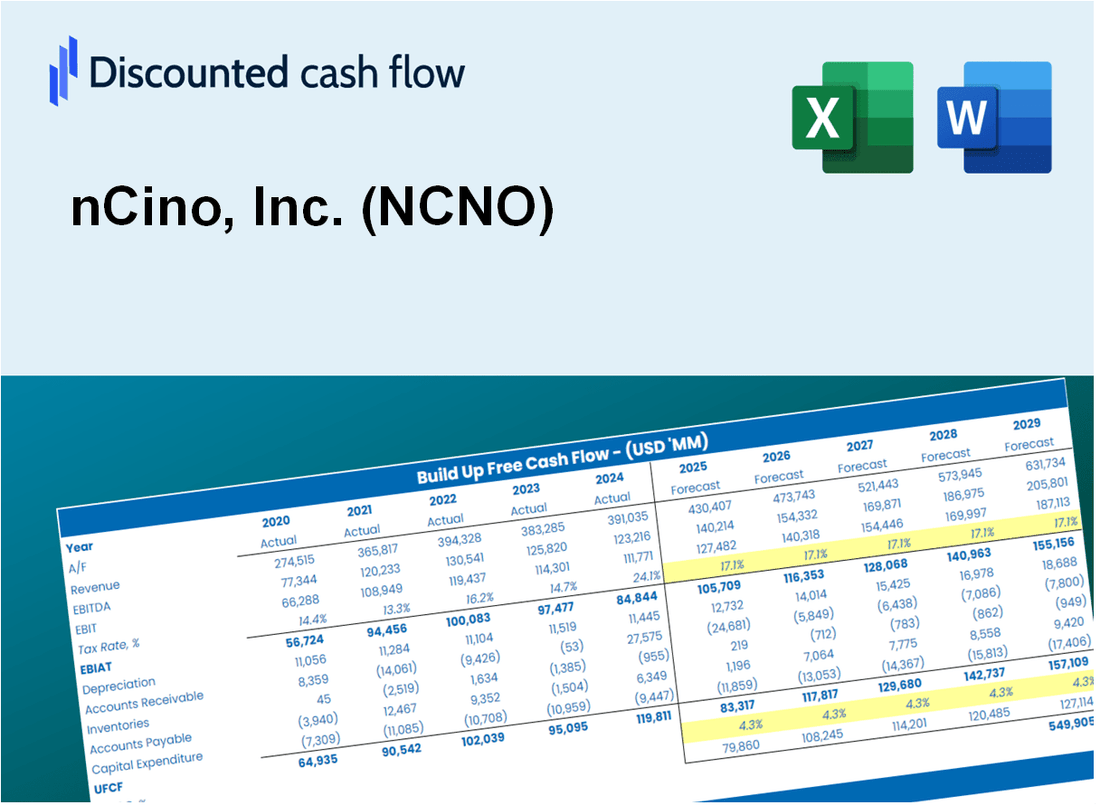
Améliorez votre analyse d'évaluation Ncino, Inc. (NCNO) avec notre calculatrice sophistiquée DCF! Avec de vraies données NCNO, ce modèle Excel vous permet d'ajuster les prévisions et les hypothèses pour déterminer avec précision la valeur intrinsèque de Ncino, Inc. (NCNO).
What You Will Get
- Pre-Filled Financial Model: nCino's actual data allows for accurate DCF valuation.
- Full Forecast Control: Modify revenue growth, profit margins, WACC, and other essential metrics.
- Instant Calculations: Real-time updates provide immediate feedback as you adjust inputs.
- Investor-Ready Template: A polished Excel file crafted for high-quality valuation presentations.
- Customizable and Reusable: Designed for adaptability, enabling repeated application for in-depth forecasts.
Key Features
- Comprehensive nCino Financials: Access reliable pre-loaded historical data and future forecasts.
- Adjustable Forecast Parameters: Modify yellow-highlighted cells such as WACC, growth rates, and profit margins.
- Real-Time Calculations: Automatic updates to DCF, Net Present Value (NPV), and cash flow assessments.
- Interactive Dashboard: User-friendly charts and summaries to visualize your valuation insights.
- Suitable for All Levels: An intuitive framework designed for investors, CFOs, and consultants alike.
How It Works
- Step 1: Download the Excel file.
- Step 2: Review pre-entered nCino data (historical and projected).
- Step 3: Adjust key assumptions (yellow cells) based on your analysis.
- Step 4: View automatic recalculations for nCino’s intrinsic value.
- Step 5: Use the outputs for investment decisions or reporting.
Why Choose nCino's Financial Calculator?
- All-in-One Solution: Combines DCF, WACC, and financial ratio analyses tailored for nCino (NCNO).
- Flexible Inputs: Modify the highlighted fields to explore different financial scenarios.
- In-Depth Analysis: Automatically computes nCino’s intrinsic value and Net Present Value.
- Built-In Data: Access to historical and forecasted data for reliable analysis.
- Expert-Level Tool: Perfect for financial analysts, investors, and business advisors focused on nCino (NCNO).
Who Should Use This Product?
- Individual Investors: Make informed decisions about buying or selling nCino, Inc. (NCNO) stock.
- Financial Analysts: Streamline valuation processes with ready-to-use financial models for nCino, Inc. (NCNO).
- Consultants: Deliver professional valuation insights on nCino, Inc. (NCNO) to clients quickly and accurately.
- Business Owners: Understand how companies like nCino, Inc. (NCNO) are valued to guide your own strategy.
- Finance Students: Learn valuation techniques using real-world data and scenarios related to nCino, Inc. (NCNO).
What the Template Contains
- Pre-Filled DCF Model: nCino’s financial data preloaded for immediate use.
- WACC Calculator: Detailed calculations for Weighted Average Cost of Capital.
- Financial Ratios: Evaluate nCino’s profitability, leverage, and efficiency.
- Editable Inputs: Change assumptions such as growth, margins, and CAPEX to fit your scenarios.
- Financial Statements: Annual and quarterly reports to support detailed analysis.
- Interactive Dashboard: Easily visualize key valuation metrics and results.
Disclaimer
All information, articles, and product details provided on this website are for general informational and educational purposes only. We do not claim any ownership over, nor do we intend to infringe upon, any trademarks, copyrights, logos, brand names, or other intellectual property mentioned or depicted on this site. Such intellectual property remains the property of its respective owners, and any references here are made solely for identification or informational purposes, without implying any affiliation, endorsement, or partnership.
We make no representations or warranties, express or implied, regarding the accuracy, completeness, or suitability of any content or products presented. Nothing on this website should be construed as legal, tax, investment, financial, medical, or other professional advice. In addition, no part of this site—including articles or product references—constitutes a solicitation, recommendation, endorsement, advertisement, or offer to buy or sell any securities, franchises, or other financial instruments, particularly in jurisdictions where such activity would be unlawful.
All content is of a general nature and may not address the specific circumstances of any individual or entity. It is not a substitute for professional advice or services. Any actions you take based on the information provided here are strictly at your own risk. You accept full responsibility for any decisions or outcomes arising from your use of this website and agree to release us from any liability in connection with your use of, or reliance upon, the content or products found herein.