
|
Eplus inc. (Plus) Évaluation DCF |
Entièrement Modifiable: Adapté À Vos Besoins Dans Excel Ou Sheets
Conception Professionnelle: Modèles Fiables Et Conformes Aux Normes Du Secteur
Pré-Construits Pour Une Utilisation Rapide Et Efficace
Compatible MAC/PC, entièrement débloqué
Aucune Expertise N'Est Requise; Facile À Suivre
ePlus inc. (PLUS) Bundle
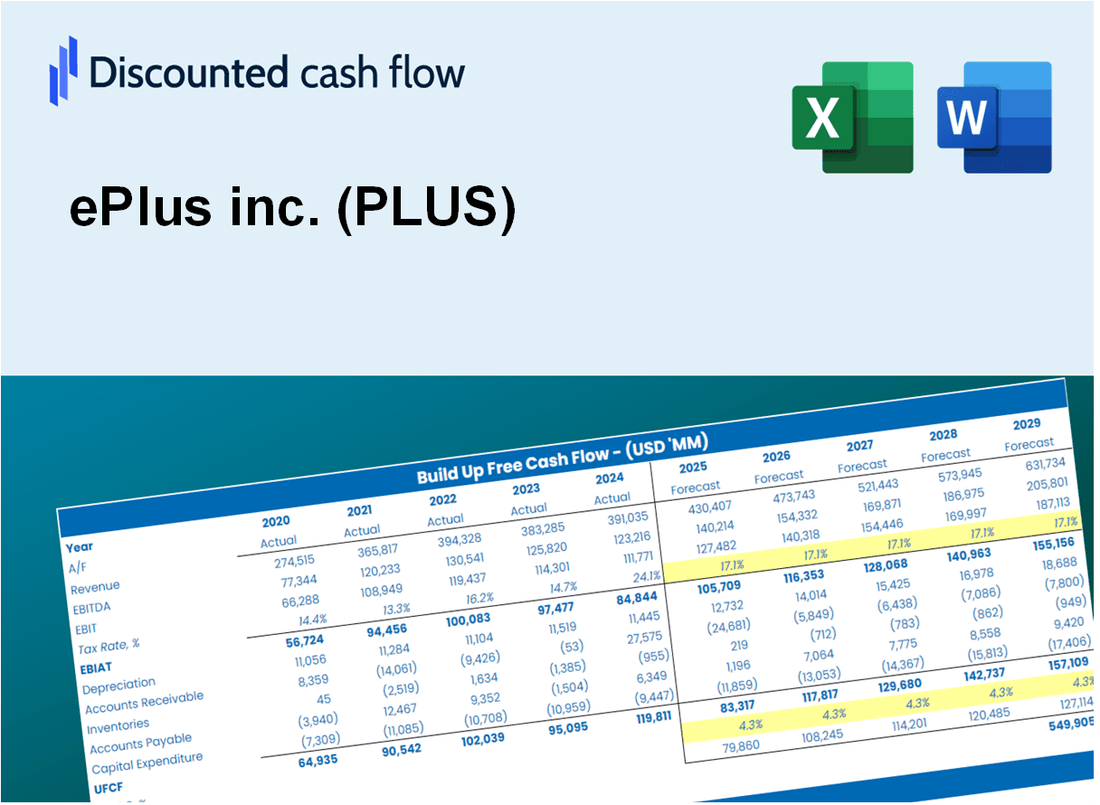
Explorez le potentiel financier d'EPLUS INC. Avec notre calculatrice DCF conviviale! Entrez vos projections pour la croissance, les marges et les dépenses pour déterminer la valeur intrinsèque d'EPLUS Inc. Et améliorer votre approche d'investissement.
Discounted Cash Flow (DCF) - (USD MM)
| Year | AY1 2021 |
AY2 2022 |
AY3 2023 |
AY4 2024 |
AY5 2025 |
FY1 2026 |
FY2 2027 |
FY3 2028 |
FY4 2029 |
FY5 2030 |
|---|---|---|---|---|---|---|---|---|---|---|
| Revenue | 1,568.3 | 1,821.0 | 2,067.7 | 2,225.3 | 2,068.8 | 2,225.2 | 2,393.5 | 2,574.5 | 2,769.2 | 2,978.6 |
| Revenue Growth, % | 0 | 16.11 | 13.55 | 7.62 | -7.03 | 7.56 | 7.56 | 7.56 | 7.56 | 7.56 |
| EBITDA | 128.8 | 172.2 | 185.7 | 185.9 | 171.7 | 192.7 | 207.3 | 223.0 | 239.8 | 258.0 |
| EBITDA, % | 8.21 | 9.46 | 8.98 | 8.35 | 8.3 | 8.66 | 8.66 | 8.66 | 8.66 | 8.66 |
| Depreciation | 20.0 | 24.3 | 18.6 | 25.9 | 29.6 | 27.2 | 29.2 | 31.4 | 33.8 | 36.4 |
| Depreciation, % | 1.27 | 1.33 | 0.89901 | 1.17 | 1.43 | 1.22 | 1.22 | 1.22 | 1.22 | 1.22 |
| EBIT | 108.8 | 147.9 | 167.1 | 159.9 | 142.1 | 165.6 | 178.1 | 191.5 | 206.0 | 221.6 |
| EBIT, % | 6.94 | 8.12 | 8.08 | 7.19 | 6.87 | 7.44 | 7.44 | 7.44 | 7.44 | 7.44 |
| Total Cash | 129.6 | 155.4 | 103.1 | 253.0 | 389.4 | 231.3 | 248.8 | 267.6 | 287.8 | 309.6 |
| Total Cash, percent | .0 | .0 | .0 | .0 | .0 | .0 | .0 | .0 | .0 | .0 |
| Account Receivables | 538.9 | 540.5 | 649.5 | 794.1 | 739.9 | 742.8 | 799.0 | 859.4 | 924.4 | 994.3 |
| Account Receivables, % | 34.36 | 29.68 | 31.41 | 35.69 | 35.77 | 33.38 | 33.38 | 33.38 | 33.38 | 33.38 |
| Inventories | 70.0 | 155.1 | 243.3 | 139.7 | 120.4 | 164.0 | 176.4 | 189.7 | 204.0 | 219.5 |
| Inventories, % | 4.46 | 8.52 | 11.77 | 6.28 | 5.82 | 7.37 | 7.37 | 7.37 | 7.37 | 7.37 |
| Accounts Payable | 165.2 | 136.2 | 220.2 | 315.7 | 451.7 | 287.8 | 309.6 | 333.0 | 358.2 | 385.3 |
| Accounts Payable, % | 10.53 | 7.48 | 10.65 | 14.19 | 21.84 | 12.94 | 12.94 | 12.94 | 12.94 | 12.94 |
| Capital Expenditure | -11.5 | -23.2 | -9.4 | -8.5 | -6.6 | -14.1 | -15.1 | -16.3 | -17.5 | -18.8 |
| Capital Expenditure, % | -0.7341 | -1.27 | -0.45364 | -0.38211 | -0.31917 | -0.63241 | -0.63241 | -0.63241 | -0.63241 | -0.63241 |
| Tax Rate, % | 27.45 | 27.45 | 27.45 | 27.45 | 27.45 | 27.45 | 27.45 | 27.45 | 27.45 | 27.45 |
| EBITAT | 75.7 | 106.4 | 122.4 | 114.9 | 103.1 | 118.9 | 127.9 | 137.6 | 148.0 | 159.2 |
| Depreciation | ||||||||||
| Changes in Account Receivables | ||||||||||
| Changes in Inventories | ||||||||||
| Changes in Accounts Payable | ||||||||||
| Capital Expenditure | ||||||||||
| UFCF | -359.5 | -8.3 | 18.4 | 186.8 | 335.5 | -78.3 | 95.2 | 102.4 | 110.1 | 118.5 |
| WACC, % | 8.32 | 8.32 | 8.32 | 8.32 | 8.32 | 8.32 | 8.32 | 8.32 | 8.32 | 8.32 |
| PV UFCF | ||||||||||
| SUM PV UFCF | 248.9 | |||||||||
| Long Term Growth Rate, % | 3.00 | |||||||||
| Free cash flow (T + 1) | 122 | |||||||||
| Terminal Value | 2,294 | |||||||||
| Present Terminal Value | 1,538 | |||||||||
| Enterprise Value | 1,787 | |||||||||
| Net Debt | -261 | |||||||||
| Equity Value | 2,048 | |||||||||
| Diluted Shares Outstanding, MM | 27 | |||||||||
| Equity Value Per Share | 76.94 |
What You Will Get
- Editable Excel Template: A fully customizable Excel-based DCF Calculator featuring pre-filled real ePlus inc. (PLUS) financials.
- Real-World Data: Historical data and forward-looking estimates (as highlighted in the yellow cells).
- Forecast Flexibility: Adjust forecast assumptions such as revenue growth, EBITDA %, and WACC.
- Automatic Calculations: Instantly observe the effect of your inputs on ePlus inc.'s (PLUS) valuation.
- Professional Tool: Designed for investors, CFOs, consultants, and financial analysts.
- User-Friendly Design: Organized for clarity and ease of use, complete with step-by-step instructions.
Key Features
- Comprehensive Financial Data: ePlus inc.'s historical financial statements and pre-filled projections.
- Customizable Parameters: Adjust WACC, tax rates, revenue growth, and EBITDA margins as needed.
- Real-Time Insights: Monitor ePlus inc.'s intrinsic value recalculating instantly.
- Visual Representation: Dashboard charts illustrate valuation outcomes and essential metrics.
- Designed for Precision: A robust tool tailored for analysts, investors, and finance professionals.
How It Works
- Step 1: Download the Excel file for ePlus inc. (PLUS).
- Step 2: Review ePlus inc.'s (PLUS) pre-filled financial data and forecasts.
- Step 3: Adjust key inputs such as revenue growth, WACC, and tax rates (highlighted cells).
- Step 4: Observe the DCF model update in real-time as you modify your assumptions.
- Step 5: Evaluate the outputs and leverage the results for your investment strategies.
Why Choose This Calculator for ePlus Inc. (PLUS)?
- User-Friendly Interface: Tailored for both novices and seasoned users.
- Customizable Inputs: Adjust parameters to suit your financial analysis needs.
- Real-Time Insights: Monitor immediate fluctuations in ePlus Inc.'s valuation as you tweak inputs.
- Preloaded Data: Comes equipped with ePlus Inc.'s actual financial figures for swift evaluations.
- Relied Upon by Experts: Favored by investors and analysts for making well-informed choices.
Who Should Use This Product?
- Professional Investors: Develop comprehensive and accurate valuation models for ePlus inc. (PLUS) portfolio assessments.
- Corporate Finance Teams: Evaluate valuation scenarios to inform internal decision-making processes for ePlus inc. (PLUS).
- Consultants and Advisors: Deliver precise valuation insights to clients regarding ePlus inc. (PLUS) stock.
- Students and Educators: Utilize real-world data to enhance financial modeling skills in the context of ePlus inc. (PLUS).
- Tech Enthusiasts: Explore the market valuation methods applied to technology companies like ePlus inc. (PLUS).
What the ePlus Inc. Template Contains
- Comprehensive DCF Model: Editable template featuring detailed valuation calculations tailored for ePlus Inc. (PLUS).
- Real-World Data: ePlus Inc.'s historical and projected financials preloaded for in-depth analysis.
- Customizable Parameters: Modify WACC, growth rates, and tax assumptions to explore various scenarios.
- Financial Statements: Complete annual and quarterly breakdowns for enhanced insights into performance.
- Key Ratios: Integrated analysis for assessing profitability, efficiency, and leverage metrics.
- Dashboard with Visual Outputs: Interactive charts and tables for clear, actionable insights.
Disclaimer
All information, articles, and product details provided on this website are for general informational and educational purposes only. We do not claim any ownership over, nor do we intend to infringe upon, any trademarks, copyrights, logos, brand names, or other intellectual property mentioned or depicted on this site. Such intellectual property remains the property of its respective owners, and any references here are made solely for identification or informational purposes, without implying any affiliation, endorsement, or partnership.
We make no representations or warranties, express or implied, regarding the accuracy, completeness, or suitability of any content or products presented. Nothing on this website should be construed as legal, tax, investment, financial, medical, or other professional advice. In addition, no part of this site—including articles or product references—constitutes a solicitation, recommendation, endorsement, advertisement, or offer to buy or sell any securities, franchises, or other financial instruments, particularly in jurisdictions where such activity would be unlawful.
All content is of a general nature and may not address the specific circumstances of any individual or entity. It is not a substitute for professional advice or services. Any actions you take based on the information provided here are strictly at your own risk. You accept full responsibility for any decisions or outcomes arising from your use of this website and agree to release us from any liability in connection with your use of, or reliance upon, the content or products found herein.