
|
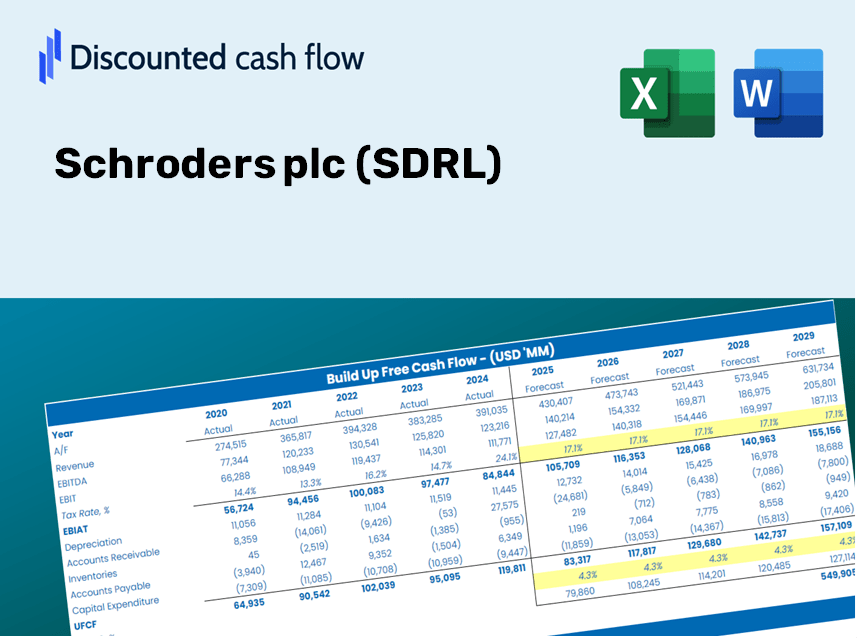
Schroders plc (SDR.L) Valation DCF |
Entièrement Modifiable: Adapté À Vos Besoins Dans Excel Ou Sheets
Conception Professionnelle: Modèles Fiables Et Conformes Aux Normes Du Secteur
Pré-Construits Pour Une Utilisation Rapide Et Efficace
Compatible MAC/PC, entièrement débloqué
Aucune Expertise N'Est Requise; Facile À Suivre
Schroders plc (SDR.L) Bundle
Évaluez les perspectives financières de Schroders plc (SDRL) en toute confiance! Cette calculatrice DCF (SDRL) fournit des données financières pré-remplies et vous permet de modifier la croissance des revenus, le WACC, les marges et d'autres hypothèses essentielles pour s'aligner sur vos prévisions.
Discounted Cash Flow (DCF) - (USD MM)
| Year | AY1 2020 |
AY2 2021 |
AY3 2022 |
AY4 2023 |
AY5 2024 |
FY1 2025 |
FY2 2026 |
FY3 2027 |
FY4 2028 |
FY5 2029 |
|---|---|---|---|---|---|---|---|---|---|---|
| Revenue | 2,568.6 | 3,023.7 | 2,928.2 | 2,936.7 | 2,970.0 | 3,088.7 | 3,212.1 | 3,340.5 | 3,473.9 | 3,612.7 |
| Revenue Growth, % | 0 | 17.72 | -3.16 | 0.29028 | 1.13 | 4 | 4 | 4 | 4 | 4 |
| EBITDA | 756.0 | 865.0 | 798.5 | 769.2 | 731.0 | 840.8 | 874.4 | 909.4 | 945.7 | 983.5 |
| EBITDA, % | 29.43 | 28.61 | 27.27 | 26.19 | 24.61 | 27.22 | 27.22 | 27.22 | 27.22 | 27.22 |
| Depreciation | 168.8 | 162.8 | 188.9 | 212.2 | 191.1 | 198.1 | 206.0 | 214.2 | 222.8 | 231.7 |
| Depreciation, % | 6.57 | 5.38 | 6.45 | 7.23 | 6.43 | 6.41 | 6.41 | 6.41 | 6.41 | 6.41 |
| EBIT | 587.2 | 702.2 | 609.6 | 557.0 | 539.9 | 642.7 | 668.4 | 695.1 | 722.9 | 751.8 |
| EBIT, % | 22.86 | 23.22 | 20.82 | 18.97 | 18.18 | 20.81 | 20.81 | 20.81 | 20.81 | 20.81 |
| Total Cash | 3,469.6 | 4,207.3 | 4,440.3 | 4,816.6 | 6,782.5 | 3,088.7 | 3,212.1 | 3,340.5 | 3,473.9 | 3,612.7 |
| Total Cash, percent | .0 | .0 | .0 | .0 | .0 | .0 | .0 | .0 | .0 | .0 |
| Account Receivables | 985.7 | 1,117.7 | 1,102.2 | 948.6 | 746.7 | 1,052.8 | 1,094.8 | 1,138.6 | 1,184.1 | 1,231.4 |
| Account Receivables, % | 38.37 | 36.96 | 37.64 | 32.3 | 25.14 | 34.08 | 34.08 | 34.08 | 34.08 | 34.08 |
| Inventories | -1,455.9 | -1,767.7 | -1,053.2 | -948.6 | .0 | -1,133.0 | -1,178.3 | -1,225.4 | -1,274.3 | -1,325.2 |
| Inventories, % | -56.68 | -58.46 | -35.97 | -32.3 | 0 | -36.68 | -36.68 | -36.68 | -36.68 | -36.68 |
| Accounts Payable | 11.0 | 8.8 | 14.7 | 143.9 | 177.6 | 74.8 | 77.7 | 80.8 | 84.1 | 87.4 |
| Accounts Payable, % | 0.42825 | 0.29103 | 0.50201 | 4.9 | 5.98 | 2.42 | 2.42 | 2.42 | 2.42 | 2.42 |
| Capital Expenditure | -92.8 | -89.4 | -104.3 | -79.9 | -70.5 | -94.1 | -97.8 | -101.7 | -105.8 | -110.0 |
| Capital Expenditure, % | -3.61 | -2.96 | -3.56 | -2.72 | -2.37 | -3.05 | -3.05 | -3.05 | -3.05 | -3.05 |
| Tax Rate, % | 22.42 | 22.42 | 22.42 | 22.42 | 22.42 | 22.42 | 22.42 | 22.42 | 22.42 | 22.42 |
| EBITAT | 503.0 | 639.7 | 582.0 | 459.9 | 418.9 | 555.8 | 578.0 | 601.1 | 625.1 | 650.1 |
| Depreciation | ||||||||||
| Changes in Account Receivables | ||||||||||
| Changes in Inventories | ||||||||||
| Changes in Accounts Payable | ||||||||||
| Capital Expenditure | ||||||||||
| UFCF | 1,060.2 | 890.7 | -26.5 | 770.4 | -173.5 | 1,383.9 | 692.4 | 720.1 | 748.8 | 778.7 |
| WACC, % | 8.34 | 8.36 | 8.37 | 8.32 | 8.31 | 8.34 | 8.34 | 8.34 | 8.34 | 8.34 |
| PV UFCF | ||||||||||
| SUM PV UFCF | 3,498.9 | |||||||||
| Long Term Growth Rate, % | 2.00 | |||||||||
| Free cash flow (T + 1) | 794 | |||||||||
| Terminal Value | 12,531 | |||||||||
| Present Terminal Value | 8,396 | |||||||||
| Enterprise Value | 11,895 | |||||||||
| Net Debt | -3,547 | |||||||||
| Equity Value | 15,441 | |||||||||
| Diluted Shares Outstanding, MM | 1,605 | |||||||||
| Equity Value Per Share | 962.02 |
What You Will Receive
- Pre-Populated Financial Model: Schroders plc’s actual data provides an accurate DCF valuation.
- Comprehensive Forecast Control: Modify revenue growth, profit margins, WACC, and other essential factors.
- Real-Time Calculations: Automatic updates allow you to view results instantly as modifications are made.
- Professional-Grade Template: A polished Excel file designed for high-quality valuation presentations.
- Flexible and Reusable: Customized for versatility, making it easy to apply for ongoing detailed forecasts.
Key Features
- Comprehensive DCF Calculator: Offers detailed unlevered and levered DCF valuation frameworks.
- WACC Analysis Tool: Features a pre-constructed Weighted Average Cost of Capital sheet with adjustable inputs.
- Customizable Forecast Parameters: Adjust growth projections, capital investments, and discount rates as needed.
- Integrated Financial Ratios: Evaluate profitability, leverage, and efficiency ratios specifically for Schroders plc (SDRL).
- Interactive Dashboard and Graphs: Visual representations that summarize essential valuation metrics for straightforward analysis.
How It Operates
- Download: Obtain the pre-built Excel file containing Schroders plc’s (SDRL) financial data.
- Personalize: Modify forecasts, such as revenue growth, EBITDA %, and WACC.
- Real-Time Updates: The intrinsic value and NPV calculations refresh automatically.
- Scenario Testing: Develop various projections and instantly compare results.
- Inform Decisions: Utilize the valuation outcomes to shape your investment strategy.
Reasons to Choose This Calculator for Schroders plc (SDRL)
- All-in-One Solution: Integrates DCF, WACC, and key financial ratio analyses in a single platform.
- Adjustable Parameters: Modify the highlighted fields to explore different investment scenarios.
- In-Depth Analytics: Automatically computes intrinsic value and Net Present Value for Schroders plc (SDRL).
- Included Data Sets: Access to historical and projected data for reliable baseline calculations.
- Professional Standard: Perfect for financial analysts, investors, and business advisors focused on Schroders plc (SDRL).
Who Can Benefit from This Product?
- Finance Students: Master valuation techniques and apply them using actual market data.
- Academics: Integrate professional-grade models into your courses or research initiatives.
- Investors: Validate your assumptions and evaluate valuation outcomes for Schroders plc (SDRL) stock.
- Analysts: Enhance your productivity with a customizable, pre-built DCF model.
- Small Business Owners: Understand how large publicly traded companies like Schroders plc (SDRL) are analyzed.
Contents of the Template
- Pre-Filled DCF Model: Schroders plc’s (SDRL) financial data preloaded for quick access.
- WACC Calculator: Comprehensive calculations for the Weighted Average Cost of Capital.
- Financial Ratios: Assess Schroders plc's (SDRL) profitability, leverage, and operational efficiency.
- Editable Inputs: Modify assumptions such as growth rates, profit margins, and capital expenditures to align with your scenarios.
- Financial Statements: Access annual and quarterly reports to facilitate in-depth analysis.
- Interactive Dashboard: Effortlessly visualize essential valuation metrics and outcomes.
Disclaimer
All information, articles, and product details provided on this website are for general informational and educational purposes only. We do not claim any ownership over, nor do we intend to infringe upon, any trademarks, copyrights, logos, brand names, or other intellectual property mentioned or depicted on this site. Such intellectual property remains the property of its respective owners, and any references here are made solely for identification or informational purposes, without implying any affiliation, endorsement, or partnership.
We make no representations or warranties, express or implied, regarding the accuracy, completeness, or suitability of any content or products presented. Nothing on this website should be construed as legal, tax, investment, financial, medical, or other professional advice. In addition, no part of this site—including articles or product references—constitutes a solicitation, recommendation, endorsement, advertisement, or offer to buy or sell any securities, franchises, or other financial instruments, particularly in jurisdictions where such activity would be unlawful.
All content is of a general nature and may not address the specific circumstances of any individual or entity. It is not a substitute for professional advice or services. Any actions you take based on the information provided here are strictly at your own risk. You accept full responsibility for any decisions or outcomes arising from your use of this website and agree to release us from any liability in connection with your use of, or reliance upon, the content or products found herein.