
|
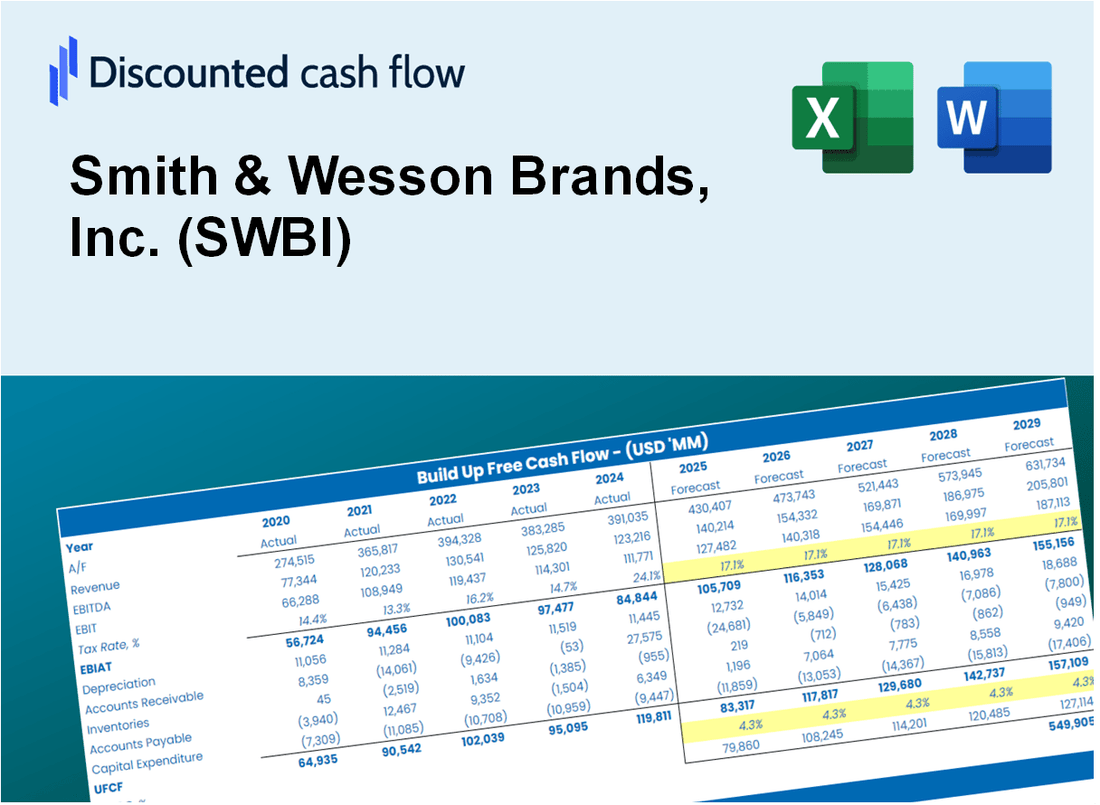
Forgeron & Wesson Brands, Inc. (SWBI) Évaluation DCF |
Entièrement Modifiable: Adapté À Vos Besoins Dans Excel Ou Sheets
Conception Professionnelle: Modèles Fiables Et Conformes Aux Normes Du Secteur
Pré-Construits Pour Une Utilisation Rapide Et Efficace
Compatible MAC/PC, entièrement débloqué
Aucune Expertise N'Est Requise; Facile À Suivre
Smith & Wesson Brands, Inc. (SWBI) Bundle
Découvrez le vrai potentiel de Smith & Wesson Brands, Inc. (SWBI) avec notre calculatrice avancée DCF! Ajustez les hypothèses cruciales, explorez divers scénarios et évaluez comment les différents facteurs affectent l'évaluation de Smith & Wesson Brands, Inc. (SWBI) - Tout dans un modèle Excel complet.
What You Will Get
- Real SWBI Financial Data: Pre-filled with Smith & Wesson’s historical and projected data for accurate analysis.
- Fully Editable Template: Easily modify key inputs such as revenue growth, WACC, and EBITDA %.
- Automatic Calculations: Watch Smith & Wesson’s intrinsic value update in real-time based on your adjustments.
- Professional Valuation Tool: Tailored for investors, analysts, and consultants aiming for precise DCF results.
- User-Friendly Design: Intuitive layout and straightforward instructions suitable for all experience levels.
Key Features
- Real-Life SWBI Data: Pre-filled with Smith & Wesson's historical financials and future projections.
- Fully Customizable Inputs: Adjust revenue growth, profit margins, weighted average cost of capital (WACC), tax rates, and capital expenditures.
- Dynamic Valuation Model: Automatic updates to Net Present Value (NPV) and intrinsic value based on your inputs.
- Scenario Testing: Create various forecast scenarios to explore different valuation outcomes.
- User-Friendly Design: Intuitive, structured, and suitable for both professionals and novices.
How It Works
- Step 1: Download the prebuilt Excel template featuring Smith & Wesson Brands, Inc. (SWBI) data.
- Step 2: Review the pre-filled sheets to familiarize yourself with the essential metrics.
- Step 3: Modify forecasts and assumptions in the editable yellow cells (WACC, growth, margins).
- Step 4: Instantly see the recalculated results, including Smith & Wesson's intrinsic value.
- Step 5: Make well-informed investment decisions or create reports based on the outputs.
Why Choose This Calculator for Smith & Wesson Brands, Inc. (SWBI)?
- All-in-One Solution: Combines DCF, WACC, and financial ratio analyses tailored for the firearms industry.
- Flexible Inputs: Modify the yellow-highlighted cells to explore different financial scenarios.
- In-Depth Analysis: Automatically computes Smith & Wesson’s intrinsic value and Net Present Value.
- Ready-to-Use Data: Historical and projected data provide a reliable foundation for analysis.
- Expert-Level Tool: Perfect for financial analysts, investors, and industry consultants focused on SWBI.
Who Should Use This Product?
- Individual Investors: Make informed decisions about buying or selling Smith & Wesson Brands, Inc. (SWBI) stock.
- Financial Analysts: Streamline valuation processes with ready-to-use financial models for Smith & Wesson Brands, Inc. (SWBI).
- Consultants: Deliver professional valuation insights regarding Smith & Wesson Brands, Inc. (SWBI) to clients quickly and accurately.
- Business Owners: Understand how firearm companies like Smith & Wesson Brands, Inc. (SWBI) are valued to guide your own strategy.
- Finance Students: Learn valuation techniques using real-world data and scenarios related to Smith & Wesson Brands, Inc. (SWBI).
What the Template Contains
- Pre-Filled DCF Model: Smith & Wesson’s financial data preloaded for immediate use.
- WACC Calculator: Comprehensive calculations for Weighted Average Cost of Capital.
- Financial Ratios: Assess Smith & Wesson’s profitability, leverage, and efficiency.
- Editable Inputs: Modify assumptions such as growth, margins, and CAPEX to suit your scenarios.
- Financial Statements: Annual and quarterly reports to facilitate detailed analysis.
- Interactive Dashboard: Effortlessly visualize key valuation metrics and results.
Disclaimer
All information, articles, and product details provided on this website are for general informational and educational purposes only. We do not claim any ownership over, nor do we intend to infringe upon, any trademarks, copyrights, logos, brand names, or other intellectual property mentioned or depicted on this site. Such intellectual property remains the property of its respective owners, and any references here are made solely for identification or informational purposes, without implying any affiliation, endorsement, or partnership.
We make no representations or warranties, express or implied, regarding the accuracy, completeness, or suitability of any content or products presented. Nothing on this website should be construed as legal, tax, investment, financial, medical, or other professional advice. In addition, no part of this site—including articles or product references—constitutes a solicitation, recommendation, endorsement, advertisement, or offer to buy or sell any securities, franchises, or other financial instruments, particularly in jurisdictions where such activity would be unlawful.
All content is of a general nature and may not address the specific circumstances of any individual or entity. It is not a substitute for professional advice or services. Any actions you take based on the information provided here are strictly at your own risk. You accept full responsibility for any decisions or outcomes arising from your use of this website and agree to release us from any liability in connection with your use of, or reliance upon, the content or products found herein.