
|
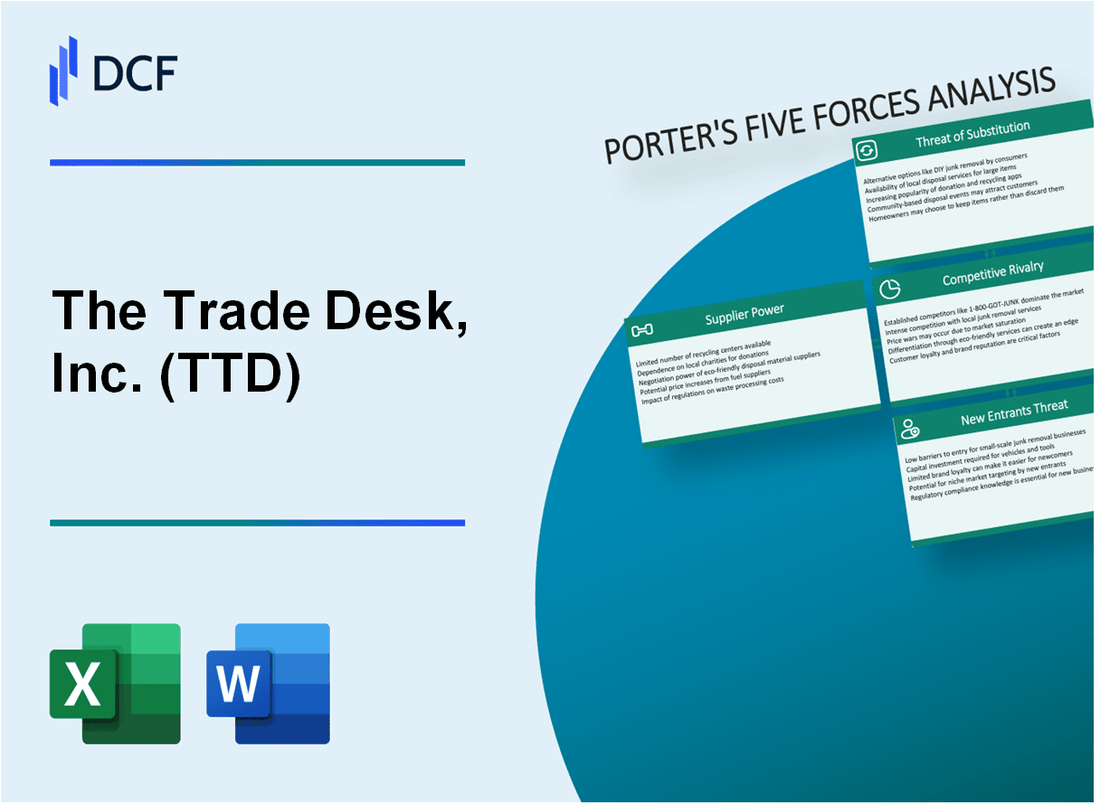
The Trade Desk, Inc. (TTD): 5 Analyse des forces [Jan-2025 MISE À JOUR] |
Entièrement Modifiable: Adapté À Vos Besoins Dans Excel Ou Sheets
Conception Professionnelle: Modèles Fiables Et Conformes Aux Normes Du Secteur
Pré-Construits Pour Une Utilisation Rapide Et Efficace
Compatible MAC/PC, entièrement débloqué
Aucune Expertise N'Est Requise; Facile À Suivre
The Trade Desk, Inc. (TTD) Bundle
Dans le monde dynamique de la publicité numérique, le Trade Desk (TTD) navigue dans un écosystème complexe où l'innovation technologique, les partenariats stratégiques et la dynamique concurrentielle façonnent sa position de marché. Alors que la publicité programmatique continue d'évoluer, la compréhension des forces complexes qui influencent la stratégie commerciale de TTD devient cruciale pour les investisseurs et les observateurs de l'industrie. Cette plongée profonde dans les cinq forces de Porter révèle les défis stratégiques et les opportunités qui définissent le paysage concurrentiel du commerce du commerce en 2024, offrant un aperçu de la façon dont l'entreprise maintient son avantage dans un environnement de marketing numérique de plus en plus sophistiqué.
The Trade Desk, Inc. (TTD) - Porter's Five Forces: Bargaining Power des fournisseurs
Nombre limité de technologies publicitaires numériques et de fournisseurs de données numériques
Au quatrième trimestre 2023, le Trade Desk a identifié 5 principaux fournisseurs de technologies de publicité numérique:
| Fournisseur | Part de marché | Revenus annuels |
|---|---|---|
| Google AD Manager | 36.2% | 224,5 milliards de dollars |
| Publicité Amazon | 13.3% | 38,1 milliards de dollars |
| Le commerce | 8.7% | 1,2 milliard de dollars |
| Appnexus | 5.6% | 620 millions de dollars |
| Mediamath | 3.9% | 412 millions de dollars |
Haute dépendance à l'égard des principales plateformes de technologie publicitaire
Les dépendances des fournisseurs du Trade Desk comprennent:
- Google: 68% de l'accès à l'inventaire de la publicité numérique
- Amazon: 22% de l'accès à l'inventaire de la publicité numérique
- Microsoft: 5% de l'accès à l'inventaire de la publicité numérique
- Autres plateformes: 5% de l'accès aux stocks numériques de la publicité numérique
Investissement dans la technologie publicitaire propriétaire
Les mesures d'investissement technologique du Trade Desk:
- Dépenses de R&D en 2023: 237,4 millions de dollars
- Investissement infrastructure technologique: 86,2 millions de dollars
- Coûts de développement technologique annuel: 324 millions de dollars
- Portefeuille de brevets: 47 Brevets de technologie de publicité numérique enregistrée
Relations complexes avec les données et les fournisseurs d'inventaire
Répartition des relations avec les fournisseurs pour 2023:
| Catégorie des fournisseurs | Nombre de partenariats | Valeur du contrat annuel |
|---|---|---|
| Fournisseurs de données | 82 | 156,7 millions de dollars |
| Fournisseurs d'inventaire | 214 | 287,3 millions de dollars |
| Partenaires technologiques | 39 | 98,5 millions de dollars |
The Trade Desk, Inc. (TTD) - Five Forces de Porter: Pouvoir de négociation des clients
GRANDES clients d'entreprise avec des budgets publicitaires importants
En 2023, le Trade Desker a siégé 719 clients d'entreprise, avec une dépense publicitaire annuelle moyenne de 1,3 million de dollars par client. Les 20 principaux clients représentaient 29% des revenus totaux, totalisant 471,6 millions de dollars.
| Segment client | Nombre de clients | Dépenses publicitaires totales |
|---|---|---|
| Clients de l'entreprise | 719 | 935,7 millions de dollars |
| Clients du marché intermédiaire | 1,243 | 412,5 millions de dollars |
Capacité à basculer entre les plateformes de publicité programmatique
Le coût de commutation pour les clients d'entreprise est estimé à 3 à 5% du budget publicitaire total, qui peut varier de 50 000 $ à 250 000 $ selon la complexité de la campagne.
Demande de solutions publicitaires transparentes et axées sur les performances
- 93% des clients d'entreprise ont besoin d'analyses de performances en temps réel
- Le client moyen s'attend à une amélioration minimale de 20% du retour sur investissement via des plateformes programmatiques
- La transparence du placement des annonces est essentielle pour 87% des grands acheteurs de publicité
Sophistication croissante des stratégies de marketing numérique
La taille du marché de la publicité numérique a atteint 602,25 milliards de dollars en 2023, avec une publicité programmatique représentant 88% de la publicité d'affichage numérique.
Sensibilité aux prix sur le marché de la publicité numérique concurrentielle
| Plate-forme | Taux CPM moyen | Part de marché |
|---|---|---|
| Le commerce | $2.75 | 17.3% |
| Google Display Network | $2.50 | 36.2% |
| Publicité Amazon | $3.00 | 13.7% |
The Trade Desk, Inc. (TTD) - Five Forces de Porter: Rivalité compétitive
Paysage compétitif Overview
Le marché des technologies de la publicité numérique démontre une concurrence intense avec les mesures clés suivantes:
| Concurrent | Part de marché | Revenus annuels |
|---|---|---|
| Google Marketing Plateforme | 32.1% | 209,5 milliards de dollars (2023) |
| Publicité Amazon | 13.3% | 37,7 milliards de dollars (2023) |
| Le commerce | 4.2% | 1,2 milliard de dollars (2023) |
Investissement de l'innovation technologique
Les dépenses de R&D du Trade Desk pour l'apprentissage automatique et les capacités de l'IA:
- 2023 dépenses de R&D: 230,4 millions de dollars
- Pourcentage de revenus investis dans la technologie: 19,2%
- Brevets de l'IA et de l'apprentissage automatique: 47 brevets actifs
Métriques de différenciation du marché
| Capacité | La performance du bureau du commerce | Benchmark de l'industrie |
|---|---|---|
| Exactitude de ciblage | 92.3% | 88.5% |
| Efficacité de gestion des données | 96.1% | 89.7% |
| Vitesse d'appel d'offres en temps réel | 0,064 secondes | 0,085 seconde |
Paysage de la technologie de la publicité numérique
Analyse de fragmentation:
- Nombre total de plateformes de technologie publicitaire: 8 000+
- Plateformes avec une présence sur le marché importante: 127
- Taux de croissance annuel du marché: 15,3%
The Trade Desk, Inc. (TTD) - Five Forces de Porter: menace de substituts
Canaux publicitaires traditionnels
Les dépenses publicitaires télévisées mondiales en 2023: 174,4 milliards de dollars. Revenus publicitaires imprimés: 44,6 milliards de dollars. Revenus publicitaires radio: 33,5 milliards de dollars.
| Canal de publicité | 2023 dépenses mondiales | Taux de baisse |
|---|---|---|
| Publicité télévisée | 174,4 milliards de dollars | -3.2% |
| Publicité imprimée | 44,6 milliards de dollars | -7.5% |
| Publicité radio | 33,5 milliards de dollars | -2.8% |
Canaux de marketing numérique
Revenus publicitaires mondiaux sur les réseaux sociaux en 2023: 268,7 milliards de dollars.
- Revenus publicitaires Facebook: 114,9 milliards de dollars
- Revenus publicitaires Instagram: 43,7 milliards de dollars
- Revenus publicitaires LinkedIn: 14,5 milliards de dollars
Relations avec l'éditeur direct
Dépenses programmatiques de publicité numérique: 558,4 milliards de dollars en 2023.
Solutions de technologie marketing interne
Dépenses de technologie marketing mondiale: 413,2 milliards de dollars en 2023.
| Segment de la technologie marketing | 2023 dépenses |
|---|---|
| Analyse marketing | 87,6 milliards de dollars |
| Technologie de publicité | 129,4 milliards de dollars |
| Gestion du contenu | 62,3 milliards de dollars |
Technologies publicitaires axées sur la confidentialité
Taille du marché mondial des technologies de confidentialité: 37,8 milliards de dollars en 2023.
- Revenus de plates-formes de gestion du consentement: 4,2 milliards de dollars
- Solutions d'anonymisation des données: 6,7 milliards de dollars
- Logiciel de conformité à la confidentialité: 5,9 milliards de dollars
The Trade Desk, Inc. (TTD) - Five Forces de Porter: menace de nouveaux entrants
Barrières élevées à l'entrée dans la technologie publicitaire programmatique
Le marché des technologies publicitaires programmatiques présente des obstacles à l'entrée substantielles pour les nouveaux concurrents. La position du marché du bureau commercial est protégée par de multiples facteurs complexes.
| Catégorie de barrière d'entrée | Métrique quantitative |
|---|---|
| Coût de développement de plate-forme initial | 50 à 100 millions de dollars |
| Investissement de R&D requis | 15-20% des revenus annuels |
| Coût d'infrastructure technologique minimum | 25 à 40 millions de dollars |
Exigences importantes d'investissement en capital
La saisie du marché des technologies de publicité programmatique exige des ressources financières substantielles.
- Capital de capital-risque minimum nécessaire: 75 millions de dollars
- Développement des infrastructures technologiques: 3-5 ans
- Développement d'algorithmes d'apprentissage automatique: 20 à 30 millions de dollars d'investissement
Infrastructure technologique complexe
La complexité technologique crée des défis d'entrée sur le marché importants.
| Composant technologique | Niveau de complexité |
|---|---|
| Systèmes d'enchères en temps réel | Haut |
| Capacités de traitement des données | Très haut |
| Intégration d'apprentissage automatique | Extrêmement élevé |
Capacités de données et d'apprentissage automatique
Les capacités technologiques avancées créent des obstacles à l'entrée du marché substantiels.
- Coût de développement du modèle d'apprentissage automatique: 15 à 25 millions de dollars
- Infrastructure annuelle de traitement des données: 10 à 15 millions de dollars
- Ressources de calcul requises: 500-1000 serveurs haute performance
Effets du réseau et relations avec les clients
Les relations de marché établies offrent une protection concurrentielle importante.
| Métrique de la relation client | Valeur quantitative |
|---|---|
| Total de la clientèle | Plus de 1 300 clients d'entreprise |
| Taux de rétention de la clientèle moyen | 85-90% |
| Valeur du contrat annuel | 500 000 $ - 5 millions de dollars par client |
The Trade Desk, Inc. (TTD) - Porter's Five Forces: Competitive rivalry
You're looking at a market where The Trade Desk, Inc. operates under intense pressure, defintely. The rivalry here isn't just with other independent demand-side platforms (DSPs); it's a constant, high-stakes battle against the giants who own the inventory, often called the 'walled gardens.'
The rivalry is extremely high with 'walled gardens' like Google, Meta, and Amazon Ads. These players control vast pools of user data and premium inventory, making direct competition for advertiser spend a daily reality. Amazon's DSP, for instance, is an aggressive competitor, especially in the high-growth retail media and connected TV (CTV) channels, where The Trade Desk, Inc. is also heavily invested.
Still, The Trade Desk, Inc. continues to scale its operations, which is a key counter-signal to the competitive heat. Analyst consensus projects The Trade Desk, Inc.'s 2025 revenue at approximately $2,790,505,000, showing continued scale even amidst the competitive fray. This projection is close to the $2.9 billion figure often discussed as a benchmark for the year's total scale.
The rivalry is intensifying as The Trade Desk, Inc.'s revenue growth rate decelerates, hitting 18% year-over-year in Q3 2025. When growth slows, every percentage point of market share becomes more expensive to win, directly raising the intensity of rivalry.
Here's a quick look at the recent top-line performance and near-term expectations that frame this competitive environment:
| Metric | Q3 2025 Actual | Q4 2025 Guidance (Minimum) |
| Revenue | $739 million | $840 million |
| Adjusted EBITDA Margin | 43% | Approximately 44.6% (based on $375M guidance) |
| Net Cash from Operations | $225 million | N/A |
To manage this rivalry, The Trade Desk, Inc. leans on platform adoption and customer stickiness. These metrics show how well they are holding their ground against the giants:
- Customer retention remained over 95% for the past 11 consecutive years.
- 85% of clients are now using the core Kokai platform.
- Video (including CTV) represented around 50% of the business in Q3.
- Mobile represented a low 30s percentage share of the business in Q3.
The company's ability to generate $155 million in free cash flow in Q3, despite the competitive environment, provides the resources needed to invest in AI and product differentiation against the walled gardens. Finance: draft 13-week cash view by Friday.
The Trade Desk, Inc. (TTD) - Porter's Five Forces: Threat of substitutes
You're analyzing The Trade Desk, Inc. (TTD) and the substitutes for its open internet programmatic platform are significant, representing massive pools of advertising dollars that could otherwise flow through your platform. Honestly, the sheer scale of the integrated Walled Gardens is the most immediate threat, but the structural shift towards Retail Media Networks (RMNs) is also rapidly carving out audience targeting budgets.
The primary substitute remains the integrated advertising model of Walled Gardens, which command an overwhelming share of the market. Alphabet (Google), Amazon, and Meta are on track to capture nearly 55% of global advertising spend outside China in 2025, totaling an estimated $524.4 billion in ad revenue for the trio this year alone. To put TTD's scale in context, its Q3 2025 revenue was $739 million, a fraction of the Walled Gardens' collective take. Google, for instance, retains an estimated 85.8% market share in global search advertising for 2025. This concentration of data and reach within closed ecosystems forces advertisers to choose between TTD's objective, open-internet approach and the convenience of the giants.
Direct-to-publisher deals bypassing the DSP/SSP stack pose a growing, though more nuanced, threat to The Trade Desk, Inc.'s platform model. This is manifesting through the increased adoption of private, curated marketplaces. In 2025, Private Marketplaces (PMPs) are projected to capture nearly $2 for every $1 spent on the open exchange. Publishers increasingly favor these negotiated deals, often called Programmatic Direct, for stable income and better control over their premium inventory. While The Trade Desk, Inc. counters this with its OpenPath offering-a direct connection to premium publishers-the industry trend shows a clear preference for curated, direct pathways over the open auction environment.
The rise of Retail Media Networks (RMNs) offers a potent substitute for open-internet audience targeting, especially for lower-funnel objectives. This segment is exploding; global RMN spend is projected to reach $176.2 billion in 2025, growing at 14.4% year-over-year. In the U.S. alone, RMN spend is expected to exceed $62 billion in 2025. This channel captures a significant share of digital budgets, expected to represent 21.9% of all global digital ad spending in 2025. The Trade Desk, Inc. has a small retail media segment, accounting for only 2-3% of its revenue, indicating a large, fast-growing area where substitutes are directly competing for budget allocation.
Traditional media channels are a declining but still-present substitute, primarily for broad brand awareness objectives. The migration of spend to digital is accelerating, with global video ad spend projected to decline 2.6% in 2025, and linear TV specifically forecast to fall 6.3%. In the U.S., total TV advertising revenue is expected to drop by 9% in 2025, with linear TV losing an estimated $4 billion in ad spending this year alone. Print advertising continues its sharp decline; U.S. print ad revenue is forecast to drop to $4.25 billion by 2029. Still, some marketers are planning modest increases to traditional budgets, with 14% planning to boost cinema and linear TV ads by over 50% compared to 2024, showing it hasn't vanished entirely.
Here's the quick math on the scale of these substitute markets versus The Trade Desk, Inc.'s platform revenue base:
| Substitute Category | Key Metric / Data Point (2025 Est.) | Value / Amount |
|---|---|---|
| Walled Gardens (Google, Meta, Amazon) | Collective Global Ad Revenue Share (Ex-China) | $524.4 billion |
| Walled Gardens (Google) | Global Search Advertising Market Share | 85.8% |
| Retail Media Networks (RMNs) | Projected Global Ad Spend | $176.2 billion |
| Retail Media Networks (RMNs) | Projected U.S. Ad Spend | Over $62 billion |
| Direct-to-Publisher Deals (PMPs) | Spend Ratio vs. Open Exchange | Nearly $2 for every $1 spent on open exchange |
| Traditional Media (Linear TV) | Projected Global Ad Spend Decline | -6.3% |
| Traditional Media (U.S. TV) | Projected Total Ad Revenue Decline | -9% |
| The Trade Desk, Inc. (TTD) | Q3 2025 Revenue | $739 million |
The competitive pressure is clear from the data points you see above. The Trade Desk, Inc. must continue to win share from the Walled Gardens and demonstrate superior value in the open internet, especially as RMNs and curated deals siphon off direct advertiser interest.
Consider these key dynamics:
- Google's search market share remains near 86%, a massive moat.
- Retail Media is expected to capture 21.9% of all digital ad spend in 2025.
- Linear TV ad spend is forecast to decline by 6.3% globally.
- PMPs are attracting significantly more programmatic dollars than open auctions.
- The Trade Desk, Inc.'s CTV segment is 48% of its revenue, putting it in direct competition with the video arms of Walled Gardens.
The Trade Desk, Inc. (TTD) - Porter's Five Forces: Threat of new entrants
You're looking at the barriers to entry in the programmatic advertising space as of late 2025. Honestly, the hurdles for a new player to challenge The Trade Desk, Inc. are significant, largely due to the sheer scale of investment already sunk into the platform.
High capital investment is required to build a global, omnichannel platform like Kokai. You see this reflected in The Trade Desk, Inc.'s operational spending. For the twelve months ending September 30, 2025, Research and Development Expenses totaled $0.522B, up 19.43% year-over-year. This consistent, high-level investment in technology is not something a startup can easily match out of the gate.
Barriers are high due to the need for proprietary data, AI technology, and a vast partner ecosystem. The success of The Trade Desk, Inc.'s platform is now tied to measurable performance gains. Clients fully utilizing the Kokai platform are seeing a 24% lower cost per conversion and a 20% lower cost per acquisition. Furthermore, in Q2 2025, customer retention remained over 95% for the eleventh consecutive year. Building that level of proven efficiency and trust takes years of deployment and data refinement.
Regulatory complexity (data privacy) and the need for new identity solutions (UID2) raise the cost of entry. Navigating the post-cookie world requires significant legal and technical overhead. Privacy laws like GDPR and CCPA force any new entrant to build compliance into their core architecture from day one, which is a massive, non-revenue-generating cost center. The need to support industry standards like Unified ID 2.0 (UID2) means new entrants must integrate complex, evolving identity frameworks just to participate effectively.
Industry consolidation is accelerating in 2025, making it harder for new startups to gain traction. The market is dominated by a few massive players, and the overall AdTech ecosystem is valued globally at $1.27 trillion in 2025. New entrants face a landscape where established players are already deeply entrenched, and the required scale is immense.
Here's a quick look at the scale of the market versus The Trade Desk, Inc.'s investment to illustrate the capital barrier:
| Metric | Value (2025) | Context |
|---|---|---|
| Global AdTech Market Size | $1.27 trillion | Overall industry scale |
| North America AdTech Market Size | $370 billion | Regional market size in 2024 |
| The Trade Desk, Inc. R&D Expenses (TTM Sep 30) | $0.522B | Annual investment in platform development |
| The Trade Desk, Inc. Q2 2025 Revenue | $694 million | Scale of current operations |
| Kokai Cost Per Conversion Improvement | 24% lower | Demonstrated platform efficiency |
The cost of building a competitive, global, and compliant platform is effectively priced in the hundreds of millions annually, which you can see from The Trade Desk, Inc.'s own R&D figures. To be fair, the market correction in 2025, with the stock down roughly 65% at one point, might make the valuation look more accessible, but the underlying technology and compliance costs remain a massive barrier to entry.
You should review the Q4 2025 guidance to see if R&D spending continues at this pace, as that will signal the ongoing commitment to maintaining this moat. Finance: draft 13-week cash view by Friday.
Disclaimer
All information, articles, and product details provided on this website are for general informational and educational purposes only. We do not claim any ownership over, nor do we intend to infringe upon, any trademarks, copyrights, logos, brand names, or other intellectual property mentioned or depicted on this site. Such intellectual property remains the property of its respective owners, and any references here are made solely for identification or informational purposes, without implying any affiliation, endorsement, or partnership.
We make no representations or warranties, express or implied, regarding the accuracy, completeness, or suitability of any content or products presented. Nothing on this website should be construed as legal, tax, investment, financial, medical, or other professional advice. In addition, no part of this site—including articles or product references—constitutes a solicitation, recommendation, endorsement, advertisement, or offer to buy or sell any securities, franchises, or other financial instruments, particularly in jurisdictions where such activity would be unlawful.
All content is of a general nature and may not address the specific circumstances of any individual or entity. It is not a substitute for professional advice or services. Any actions you take based on the information provided here are strictly at your own risk. You accept full responsibility for any decisions or outcomes arising from your use of this website and agree to release us from any liability in connection with your use of, or reliance upon, the content or products found herein.