
|
YEXT, Inc. (Yext) Valation DCF |
Entièrement Modifiable: Adapté À Vos Besoins Dans Excel Ou Sheets
Conception Professionnelle: Modèles Fiables Et Conformes Aux Normes Du Secteur
Pré-Construits Pour Une Utilisation Rapide Et Efficace
Compatible MAC/PC, entièrement débloqué
Aucune Expertise N'Est Requise; Facile À Suivre
Yext, Inc. (YEXT) Bundle
Évaluez les perspectives financières de Yext, Inc. (Yext) comme un expert! Cette calculatrice (YEXT) DCF fournit des données financières pré-remplies et la flexibilité pour modifier la croissance des revenus, le WACC, les marges et d'autres hypothèses critiques pour s'aligner sur vos prévisions.
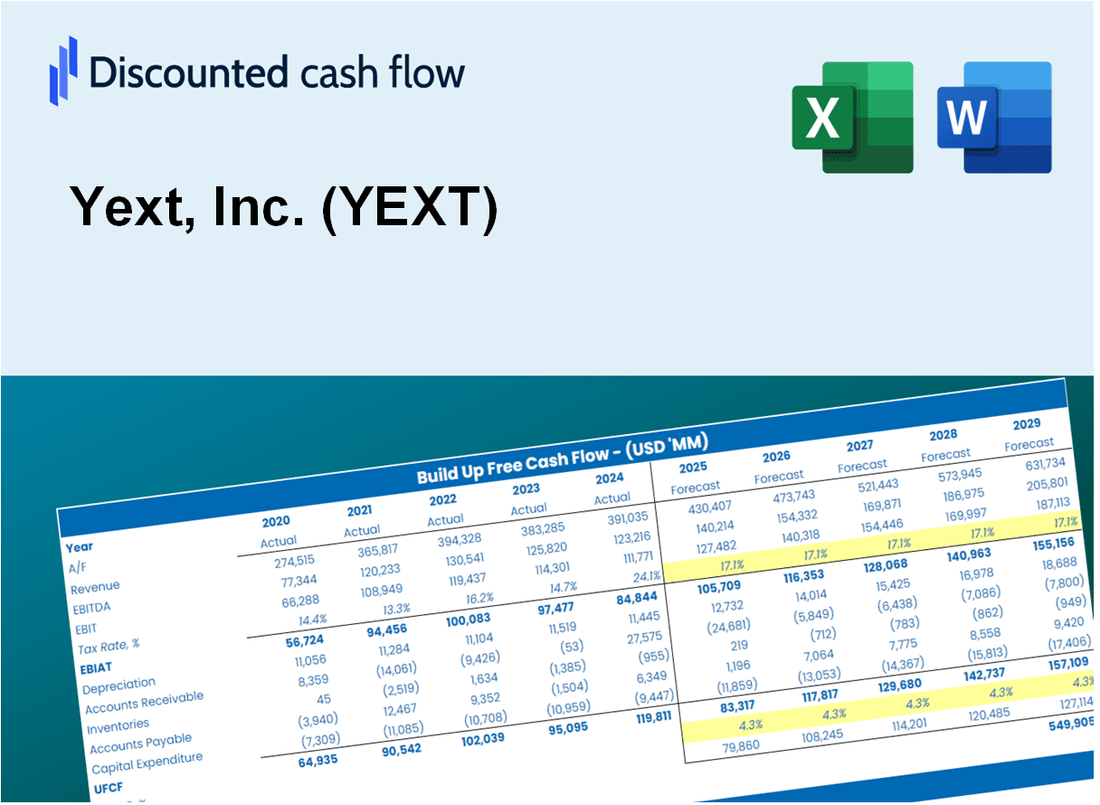
Discounted Cash Flow (DCF) - (USD MM)
| Year | AY1 2021 |
AY2 2022 |
AY3 2023 |
AY4 2024 |
AY5 2025 |
FY1 2026 |
FY2 2027 |
FY3 2028 |
FY4 2029 |
FY5 2030 |
|---|---|---|---|---|---|---|---|---|---|---|
| Revenue | 354.7 | 390.6 | 400.9 | 404.3 | 421.0 | 439.6 | 459.1 | 479.5 | 500.7 | 522.9 |
| Revenue Growth, % | 0 | 10.13 | 2.63 | 0.86616 | 4.11 | 4.43 | 4.43 | 4.43 | 4.43 | 4.43 |
| EBITDA | -71.2 | -65.4 | -36.9 | 24.7 | .2 | -35.0 | -36.6 | -38.2 | -39.9 | -41.7 |
| EBITDA, % | -20.07 | -16.73 | -9.2 | 6.12 | 0.04014662 | -7.97 | -7.97 | -7.97 | -7.97 | -7.97 |
| Depreciation | 22.8 | 26.1 | 26.4 | 24.6 | 27.3 | 28.4 | 29.6 | 30.9 | 32.3 | 33.7 |
| Depreciation, % | 6.43 | 6.68 | 6.58 | 6.09 | 6.48 | 6.45 | 6.45 | 6.45 | 6.45 | 6.45 |
| EBIT | -94.0 | -91.4 | -63.3 | .1 | -27.1 | -63.4 | -66.2 | -69.1 | -72.2 | -75.4 |
| EBIT, % | -26.5 | -23.41 | -15.78 | 0.03264725 | -6.44 | -14.42 | -14.42 | -14.42 | -14.42 | -14.42 |
| Total Cash | 230.4 | 261.2 | 190.2 | 210.2 | 123.1 | 229.1 | 239.2 | 249.8 | 260.9 | 272.5 |
| Total Cash, percent | .0 | .0 | .0 | .0 | .0 | .0 | .0 | .0 | .0 | .0 |
| Account Receivables | 97.5 | 101.6 | 109.7 | 108.2 | 112.9 | 118.2 | 123.5 | 128.9 | 134.7 | 140.6 |
| Account Receivables, % | 27.48 | 26.01 | 27.37 | 26.76 | 26.83 | 26.89 | 26.89 | 26.89 | 26.89 | 26.89 |
| Inventories | 30.3 | 34.0 | 31.0 | .0 | .0 | 22.0 | 23.0 | 24.0 | 25.0 | 26.1 |
| Inventories, % | 8.55 | 8.7 | 7.74 | 0 | 0 | 5 | 5 | 5 | 5 | 5 |
| Accounts Payable | 11.5 | 9.2 | 7.3 | 7.4 | 4.8 | 9.1 | 9.5 | 10.0 | 10.4 | 10.9 |
| Accounts Payable, % | 3.24 | 2.36 | 1.81 | 1.84 | 1.13 | 2.08 | 2.08 | 2.08 | 2.08 | 2.08 |
| Capital Expenditure | -65.1 | -13.4 | -6.2 | -2.7 | -2.1 | -21.5 | -22.5 | -23.5 | -24.5 | -25.6 |
| Capital Expenditure, % | -18.36 | -3.44 | -1.54 | -0.67471 | -0.4953 | -4.9 | -4.9 | -4.9 | -4.9 | -4.9 |
| Tax Rate, % | 0.39205 | 0.39205 | 0.39205 | 0.39205 | 0.39205 | 0.39205 | 0.39205 | 0.39205 | 0.39205 | 0.39205 |
| EBITAT | -94.1 | -92.7 | -65.3 | 1.0 | -27.0 | -63.3 | -66.1 | -69.1 | -72.1 | -75.3 |
| Depreciation | ||||||||||
| Changes in Account Receivables | ||||||||||
| Changes in Inventories | ||||||||||
| Changes in Accounts Payable | ||||||||||
| Capital Expenditure | ||||||||||
| UFCF | -252.7 | -90.1 | -52.2 | 55.6 | -9.2 | -79.4 | -64.9 | -67.7 | -70.7 | -73.9 |
| WACC, % | 7.7 | 7.7 | 7.7 | 7.7 | 7.7 | 7.7 | 7.7 | 7.7 | 7.7 | 7.7 |
| PV UFCF | ||||||||||
| SUM PV UFCF | -287.4 | |||||||||
| Long Term Growth Rate, % | 2.00 | |||||||||
| Free cash flow (T + 1) | -75 | |||||||||
| Terminal Value | -1,322 | |||||||||
| Present Terminal Value | -912 | |||||||||
| Enterprise Value | -1,200 | |||||||||
| Net Debt | -28 | |||||||||
| Equity Value | -1,172 | |||||||||
| Diluted Shares Outstanding, MM | 127 | |||||||||
| Equity Value Per Share | -9.24 |
What You Will Get
- Comprehensive YEXT Financials: Access to historical and projected data for precise valuation.
- Customizable Inputs: Adjust WACC, tax rates, revenue growth, and capital expenditures as needed.
- Real-Time Calculations: Intrinsic value and NPV are computed automatically.
- Scenario Analysis: Evaluate various scenarios to assess Yext’s future performance.
- User-Friendly Interface: Designed for professionals while remaining accessible to newcomers.
Key Features
- Comprehensive Yext Data: Gain access to accurate pre-loaded historical performance metrics and future expectations.
- Adjustable Forecast Parameters: Modify highlighted cells for key variables such as WACC, growth rates, and profit margins.
- Real-Time Calculations: Instant updates to DCF, Net Present Value (NPV), and cash flow assessments.
- Interactive Dashboard: User-friendly graphs and summaries to help visualize your valuation outcomes.
- Designed for All Levels: An intuitive layout tailored for investors, CFOs, and consultants alike.
How It Works
- 1. Access the Template: Download and open the Excel file containing Yext, Inc.'s (YEXT) preloaded data.
- 2. Modify Key Inputs: Adjust essential parameters such as growth projections, WACC, and capital expenditures.
- 3. See Results Immediately: The DCF model automatically computes intrinsic value and NPV in real-time.
- 4. Explore Different Scenarios: Evaluate various forecasts to investigate alternative valuation results.
- 5. Present with Assurance: Deliver professional valuation analysis to reinforce your decision-making process.
Why Choose This Calculator for Yext, Inc. (YEXT)?
- All-in-One Solution: Features DCF, WACC, and financial ratio analyses tailored for Yext, Inc. (YEXT).
- Flexible Inputs: Modify the highlighted cells to explore different financial scenarios for Yext, Inc. (YEXT).
- In-Depth Analysis: Automatically computes Yext, Inc. (YEXT)'s intrinsic value and Net Present Value.
- Preloaded Information: Access historical and forecasted data for precise calculations related to Yext, Inc. (YEXT).
- High-Quality Standards: Perfect for financial analysts, investors, and consultants focused on Yext, Inc. (YEXT).
Who Should Use Yext, Inc. (YEXT)?
- Business Owners: Enhance your online presence and manage business information effortlessly.
- Marketing Professionals: Streamline local SEO efforts with an intuitive platform designed for optimization.
- Agencies: Deliver comprehensive solutions to clients looking to improve their digital footprint.
- Brand Managers: Gain insights into customer interactions and brand visibility across various platforms.
- Students and Educators: Explore real-world applications of digital marketing strategies in academic settings.
What the Template Contains
- Comprehensive DCF Model: Editable template featuring detailed valuation calculations tailored for Yext, Inc. (YEXT).
- Real-World Data: Yext’s historical and projected financials preloaded for thorough analysis.
- Customizable Parameters: Modify WACC, growth rates, and tax assumptions to explore various scenarios.
- Financial Statements: Complete annual and quarterly breakdowns for enhanced insights into Yext’s performance.
- Key Ratios: Integrated analysis for profitability, efficiency, and leverage specific to Yext, Inc. (YEXT).
- Dashboard with Visual Outputs: Charts and tables designed for clear, actionable insights on Yext’s financial health.
Disclaimer
All information, articles, and product details provided on this website are for general informational and educational purposes only. We do not claim any ownership over, nor do we intend to infringe upon, any trademarks, copyrights, logos, brand names, or other intellectual property mentioned or depicted on this site. Such intellectual property remains the property of its respective owners, and any references here are made solely for identification or informational purposes, without implying any affiliation, endorsement, or partnership.
We make no representations or warranties, express or implied, regarding the accuracy, completeness, or suitability of any content or products presented. Nothing on this website should be construed as legal, tax, investment, financial, medical, or other professional advice. In addition, no part of this site—including articles or product references—constitutes a solicitation, recommendation, endorsement, advertisement, or offer to buy or sell any securities, franchises, or other financial instruments, particularly in jurisdictions where such activity would be unlawful.
All content is of a general nature and may not address the specific circumstances of any individual or entity. It is not a substitute for professional advice or services. Any actions you take based on the information provided here are strictly at your own risk. You accept full responsibility for any decisions or outcomes arising from your use of this website and agree to release us from any liability in connection with your use of, or reliance upon, the content or products found herein.