
|
Yunji Inc. (YJ) Évaluation DCF |
Entièrement Modifiable: Adapté À Vos Besoins Dans Excel Ou Sheets
Conception Professionnelle: Modèles Fiables Et Conformes Aux Normes Du Secteur
Pré-Construits Pour Une Utilisation Rapide Et Efficace
Compatible MAC/PC, entièrement débloqué
Aucune Expertise N'Est Requise; Facile À Suivre
Yunji Inc. (YJ) Bundle
Explorez les prospects financiers de Yunji Inc. (YJ) avec notre calculatrice DCF conviviale! Entrez vos projections pour la croissance, les marges et les dépenses pour calculer la valeur intrinsèque de Yunji Inc. (YJ) et affiner votre approche d'investissement.
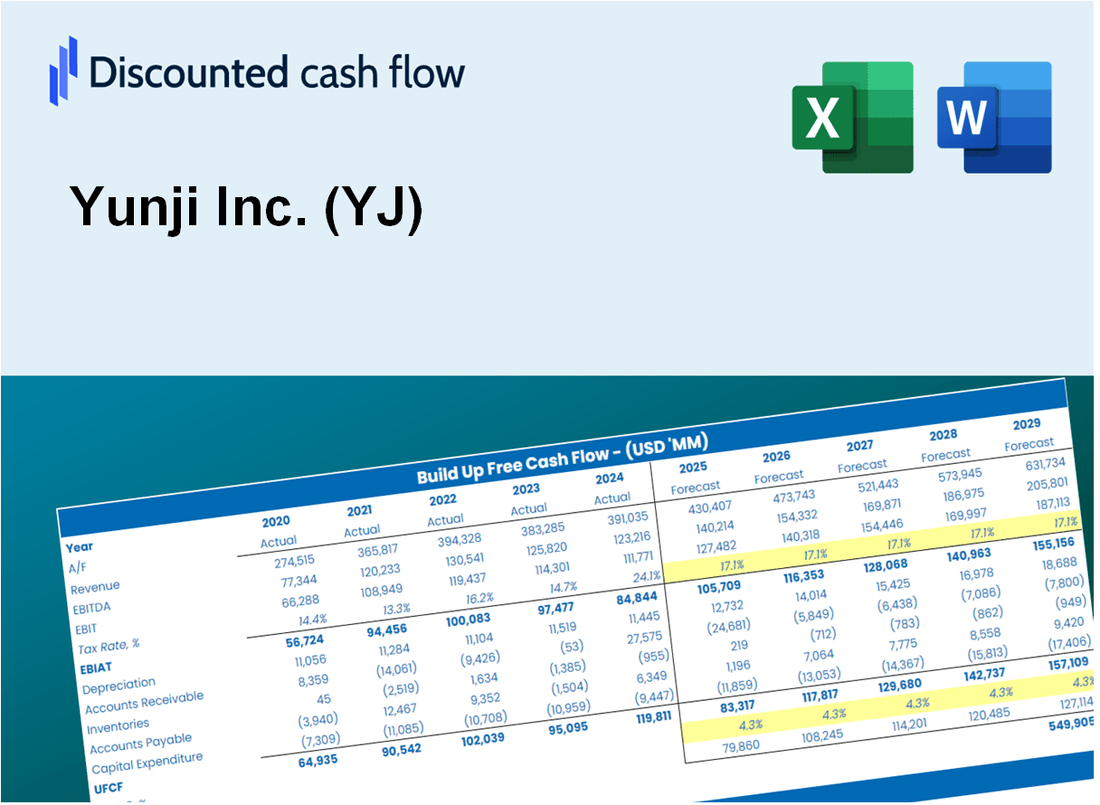
Discounted Cash Flow (DCF) - (USD MM)
| Year | AY1 2020 |
AY2 2021 |
AY3 2022 |
AY4 2023 |
AY5 2024 |
FY1 2025 |
FY2 2026 |
FY3 2027 |
FY4 2028 |
FY5 2029 |
|---|---|---|---|---|---|---|---|---|---|---|
| Revenue | 777.1 | 302.9 | 162.2 | 90.0 | 58.7 | 65.4 | 72.9 | 81.2 | 90.5 | 100.9 |
| Revenue Growth, % | 0 | -61.03 | -46.45 | -44.53 | -34.76 | 11.45 | 11.45 | 11.45 | 11.45 | 11.45 |
| EBITDA | -9.2 | 2.6 | -13.2 | -19.8 | -14.5 | -7.2 | -8.1 | -9.0 | -10.0 | -11.1 |
| EBITDA, % | -1.18 | 0.86538 | -8.11 | -22.04 | -24.79 | -11.05 | -11.05 | -11.05 | -11.05 | -11.05 |
| Depreciation | 5.2 | 2.8 | 1.5 | 1.2 | 1.8 | .9 | 1.0 | 1.1 | 1.2 | 1.4 |
| Depreciation, % | 0.66518 | 0.92295 | 0.9091 | 1.29 | 3 | 1.36 | 1.36 | 1.36 | 1.36 | 1.36 |
| EBIT | -14.4 | -.2 | -14.6 | -21.0 | -16.3 | -8.1 | -9.0 | -10.1 | -11.2 | -12.5 |
| EBIT, % | -1.85 | -0.05757736 | -9.02 | -23.33 | -27.79 | -12.41 | -12.41 | -12.41 | -12.41 | -12.41 |
| Total Cash | 168.4 | 133.1 | 88.1 | 73.7 | 30.8 | 33.3 | 37.1 | 41.3 | 46.1 | 51.3 |
| Total Cash, percent | .0 | .0 | .0 | .0 | .0 | .0 | .0 | .0 | .0 | .0 |
| Account Receivables | 24.3 | 17.0 | 13.3 | 9.2 | 30.6 | 10.4 | 11.6 | 12.9 | 14.4 | 16.0 |
| Account Receivables, % | 3.12 | 5.6 | 8.17 | 10.26 | 52.2 | 15.87 | 15.87 | 15.87 | 15.87 | 15.87 |
| Inventories | 19.0 | 11.9 | 7.7 | 6.0 | 4.1 | 3.2 | 3.6 | 4.0 | 4.5 | 5.0 |
| Inventories, % | 2.45 | 3.92 | 4.74 | 6.67 | 7.05 | 4.96 | 4.96 | 4.96 | 4.96 | 4.96 |
| Accounts Payable | 70.5 | 35.8 | 19.5 | 13.6 | 7.7 | 8.0 | 8.9 | 9.9 | 11.1 | 12.3 |
| Accounts Payable, % | 9.07 | 11.82 | 12.04 | 15.12 | 13.09 | 12.23 | 12.23 | 12.23 | 12.23 | 12.23 |
| Capital Expenditure | -11.9 | -12.2 | -13.0 | -1.7 | -27.1 | -8.1 | -9.0 | -10.0 | -11.2 | -12.4 |
| Capital Expenditure, % | -1.53 | -4.04 | -7.99 | -1.94 | -46.1 | -12.32 | -12.32 | -12.32 | -12.32 | -12.32 |
| Tax Rate, % | -1.65 | -1.65 | -1.65 | -1.65 | -1.65 | -1.65 | -1.65 | -1.65 | -1.65 | -1.65 |
| EBITAT | -19.6 | -.1 | -18.0 | -22.0 | -16.6 | -7.5 | -8.4 | -9.3 | -10.4 | -11.6 |
| Depreciation | ||||||||||
| Changes in Account Receivables | ||||||||||
| Changes in Inventories | ||||||||||
| Changes in Accounts Payable | ||||||||||
| Capital Expenditure | ||||||||||
| UFCF | 1.0 | -29.8 | -37.9 | -22.8 | -67.3 | 6.8 | -17.0 | -19.0 | -21.1 | -23.5 |
| WACC, % | 3.75 | 2.39 | 3.75 | 3.75 | 3.75 | 3.48 | 3.48 | 3.48 | 3.48 | 3.48 |
| PV UFCF | ||||||||||
| SUM PV UFCF | -64.7 | |||||||||
| Long Term Growth Rate, % | 0.50 | |||||||||
| Free cash flow (T + 1) | -24 | |||||||||
| Terminal Value | -794 | |||||||||
| Present Terminal Value | -670 | |||||||||
| Enterprise Value | -734 | |||||||||
| Net Debt | -29 | |||||||||
| Equity Value | -705 | |||||||||
| Diluted Shares Outstanding, MM | 0 | |||||||||
| Equity Value Per Share | -57,350.35 |
What You Will Receive
- Pre-Filled Financial Model: Yunji Inc.’s actual data allows for accurate DCF valuation.
- Comprehensive Forecast Control: Modify revenue growth, profit margins, WACC, and other essential factors.
- Real-Time Calculations: Instant updates provide immediate results as you adjust parameters.
- Professional-Grade Template: A polished Excel file crafted for high-quality valuation presentations.
- Flexible and Reusable: Designed for adaptability, enabling repeated application for in-depth forecasts.
Key Features
- Accurate Yunji Financials: Gain access to reliable pre-loaded historical data and future forecasts.
- Customizable Projection Assumptions: Modify highlighted cells for metrics like WACC, growth rates, and profit margins.
- Real-Time Calculations: Instant updates to DCF, Net Present Value (NPV), and cash flow assessments.
- Interactive Dashboard: User-friendly charts and summaries to effectively visualize your valuation outcomes.
- Designed for All Skill Levels: An easy-to-navigate format tailored for investors, CFOs, and consultants alike.
How It Works
- Step 1: Download the Excel file for Yunji Inc. (YJ).
- Step 2: Review Yunji's pre-filled financial data and forecasts.
- Step 3: Modify key inputs such as revenue growth, WACC, and tax rates (highlighted cells).
- Step 4: Observe the DCF model update in real-time as you adjust your assumptions.
- Step 5: Analyze the outputs and leverage the results for your investment decisions.
Why Choose Yunji Inc. (YJ)?
- Time Efficiency: Skip the hassle of building financial models from the ground up – our tools are ready to go.
- Enhanced Accuracy: Dependable financial metrics and formulas minimize valuation errors.
- Fully Adaptable: Customize the model to align with your specific assumptions and forecasts.
- User-Friendly: Intuitive charts and outputs simplify the analysis of results.
- Endorsed by Professionals: Crafted for experts who prioritize both accuracy and ease of use.
Who Should Use This Product?
- Investors: Evaluate Yunji Inc.'s (YJ) market position before making investment decisions.
- CFOs and Financial Analysts: Enhance valuation methodologies and assess future growth projections.
- Startup Founders: Gain insights into the valuation strategies of established companies like Yunji Inc. (YJ).
- Consultants: Provide detailed valuation analyses and reports for your clients.
- Students and Educators: Utilize real-time data from Yunji Inc. (YJ) to practice and teach financial valuation concepts.
What the Template Contains
- Historical Data: Includes Yunji Inc.'s (YJ) past financials and baseline forecasts.
- DCF and Levered DCF Models: Comprehensive templates to calculate Yunji Inc.'s (YJ) intrinsic value.
- WACC Sheet: Pre-built calculations for Weighted Average Cost of Capital.
- Editable Inputs: Adjust key drivers such as growth rates, EBITDA %, and CAPEX assumptions.
- Quarterly and Annual Statements: A thorough breakdown of Yunji Inc.'s (YJ) financials.
- Interactive Dashboard: Visualize valuation results and projections in real-time.
Disclaimer
All information, articles, and product details provided on this website are for general informational and educational purposes only. We do not claim any ownership over, nor do we intend to infringe upon, any trademarks, copyrights, logos, brand names, or other intellectual property mentioned or depicted on this site. Such intellectual property remains the property of its respective owners, and any references here are made solely for identification or informational purposes, without implying any affiliation, endorsement, or partnership.
We make no representations or warranties, express or implied, regarding the accuracy, completeness, or suitability of any content or products presented. Nothing on this website should be construed as legal, tax, investment, financial, medical, or other professional advice. In addition, no part of this site—including articles or product references—constitutes a solicitation, recommendation, endorsement, advertisement, or offer to buy or sell any securities, franchises, or other financial instruments, particularly in jurisdictions where such activity would be unlawful.
All content is of a general nature and may not address the specific circumstances of any individual or entity. It is not a substitute for professional advice or services. Any actions you take based on the information provided here are strictly at your own risk. You accept full responsibility for any decisions or outcomes arising from your use of this website and agree to release us from any liability in connection with your use of, or reliance upon, the content or products found herein.