
|
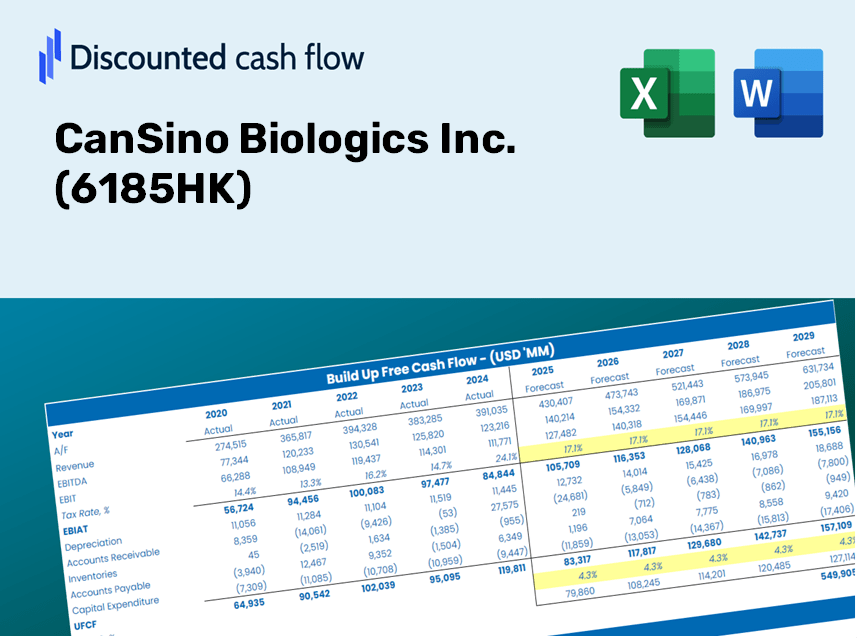
CanSino Biologics Inc. (6185.HK) DCF Valuation |
Fully Editable: Tailor To Your Needs In Excel Or Sheets
Professional Design: Trusted, Industry-Standard Templates
Investor-Approved Valuation Models
MAC/PC Compatible, Fully Unlocked
No Expertise Is Needed; Easy To Follow
CanSino Biologics Inc. (6185.HK) Bundle
Whether you're an investor or analyst, this CanSino Biologics Inc. (6185HK) DCF Calculator is your go-to tool for accurate valuation. Preloaded with CanSino Biologics Inc. real data, you can modify forecasts and observe the results in real-time.
Discounted Cash Flow (DCF) - (USD MM)
| Year | AY1 2020 |
AY2 2021 |
AY3 2022 |
AY4 2023 |
AY5 2024 |
FY1 2025 |
FY2 2026 |
FY3 2027 |
FY4 2028 |
FY5 2029 |
|---|---|---|---|---|---|---|---|---|---|---|
| Revenue | 27.2 | 4,701.7 | 1,127.4 | 377.5 | 925.5 | 1,058.4 | 1,210.4 | 1,384.3 | 1,583.2 | 1,810.6 |
| Revenue Growth, % | 0 | 17174.82 | -76.02 | -66.52 | 145.19 | 14.36 | 14.36 | 14.36 | 14.36 | 14.36 |
| EBITDA | -545.4 | 2,022.1 | -1,442.2 | -1,799.5 | -147.4 | -577.7 | -660.7 | -755.6 | -864.2 | -988.3 |
| EBITDA, % | -2003.83 | 43.01 | -127.91 | -476.76 | -15.93 | -54.58 | -54.58 | -54.58 | -54.58 | -54.58 |
| Depreciation | 20.7 | 71.2 | 197.0 | 294.2 | 262.9 | 426.1 | 487.4 | 557.4 | 637.4 | 729.0 |
| Depreciation, % | 75.98 | 1.51 | 17.47 | 77.95 | 28.4 | 40.26 | 40.26 | 40.26 | 40.26 | 40.26 |
| EBIT | -566.1 | 1,950.9 | -1,639.1 | -2,093.8 | -410.3 | -641.1 | -733.1 | -838.5 | -958.9 | -1,096.6 |
| EBIT, % | -2079.82 | 41.49 | -145.39 | -554.7 | -44.33 | -60.57 | -60.57 | -60.57 | -60.57 | -60.57 |
| Total Cash | 5,591.8 | 8,510.6 | 6,502.8 | 4,505.2 | 3,494.2 | 1,058.4 | 1,210.4 | 1,384.3 | 1,583.2 | 1,810.6 |
| Total Cash, percent | .0 | .0 | .0 | .0 | .0 | .0 | .0 | .0 | .0 | .0 |
| Account Receivables | 24.2 | 172.7 | 935.5 | 762.0 | 867.5 | 781.8 | 894.1 | 1,022.6 | 1,169.5 | 1,337.5 |
| Account Receivables, % | 88.96 | 3.67 | 82.97 | 201.87 | 93.73 | 73.87 | 73.87 | 73.87 | 73.87 | 73.87 |
| Inventories | 186.5 | 957.5 | 741.1 | 385.8 | 306.7 | 675.8 | 772.9 | 883.9 | 1,010.8 | 1,156.0 |
| Inventories, % | 685.06 | 20.36 | 65.74 | 102.22 | 33.15 | 63.85 | 63.85 | 63.85 | 63.85 | 63.85 |
| Accounts Payable | 66.2 | 921.3 | 276.8 | 113.7 | 68.3 | 384.5 | 439.7 | 502.9 | 575.2 | 657.8 |
| Accounts Payable, % | 243.36 | 19.6 | 24.55 | 30.12 | 7.38 | 36.33 | 36.33 | 36.33 | 36.33 | 36.33 |
| Capital Expenditure | -296.1 | -1,315.6 | -1,175.5 | -667.5 | -500.4 | -808.7 | -924.9 | -1,057.8 | -1,209.7 | -1,383.5 |
| Capital Expenditure, % | -1087.88 | -27.98 | -104.26 | -176.85 | -54.07 | -76.41 | -76.41 | -76.41 | -76.41 | -76.41 |
| Tax Rate, % | 0.6086 | 0.6086 | 0.6086 | 0.6086 | 0.6086 | 0.6086 | 0.6086 | 0.6086 | 0.6086 | 0.6086 |
| EBITAT | -566.1 | 1,928.3 | -1,259.0 | -1,568.8 | -407.8 | -576.9 | -659.8 | -754.6 | -863.0 | -986.9 |
| Depreciation | ||||||||||
| Changes in Account Receivables | ||||||||||
| Changes in Inventories | ||||||||||
| Changes in Accounts Payable | ||||||||||
| Capital Expenditure | ||||||||||
| UFCF | -985.9 | 619.5 | -3,428.6 | -1,576.4 | -717.2 | -926.7 | -1,251.5 | -1,431.3 | -1,636.8 | -1,872.0 |
| WACC, % | 8.84 | 8.83 | 8.71 | 8.7 | 8.83 | 8.78 | 8.78 | 8.78 | 8.78 | 8.78 |
| PV UFCF | ||||||||||
| SUM PV UFCF | -5,419.0 | |||||||||
| Long Term Growth Rate, % | 2.00 | |||||||||
| Free cash flow (T + 1) | -1,909 | |||||||||
| Terminal Value | -28,151 | |||||||||
| Present Terminal Value | -18,480 | |||||||||
| Enterprise Value | -23,899 | |||||||||
| Net Debt | 500 | |||||||||
| Equity Value | -24,398 | |||||||||
| Diluted Shares Outstanding, MM | 248 | |||||||||
| Equity Value Per Share | -98.53 |
Benefits of Choosing CanSino Biologics (6185HK)
- Comprehensive Financial Data: Access both historical and projected financial figures for precise evaluations.
- Customizable Parameters: Adjust variables such as WACC, tax rates, revenue growth, and capital expenditures to fit your analysis needs.
- Real-Time Calculations: Intrinsic value and NPV are computed automatically, providing instant insights.
- Scenario Modeling: Explore various scenarios to assess CanSino’s potential future performance.
- User-Friendly Interface: Designed for both industry experts and newcomers, ensuring ease of use for all.
Key Features
- Pre-Loaded Data: CanSino Biologics' historical financial statements and pre-filled forecasts.
- Fully Adjustable Inputs: Modify WACC, tax rates, revenue growth, and EBITDA margins to suit your analysis.
- Instant Results: View CanSino Biologics' intrinsic value recalculating in real time.
- Clear Visual Outputs: Dashboard charts clearly illustrate valuation results and important metrics.
- Built for Accuracy: A professional-grade tool designed for analysts, investors, and finance professionals.
How It Operates
- 1. Access the Template: Download the Excel file containing CanSino Biologics Inc.’s (6185HK) preloaded data.
- 2. Adjust Assumptions: Modify critical inputs such as growth projections, WACC, and capital expenditures.
- 3. Instantly View Results: The DCF model automatically calculates intrinsic value and NPV in real time.
- 4. Explore Scenarios: Analyze various forecasts to evaluate different valuation possibilities.
- 5. Present with Confidence: Share professional valuation insights to bolster your strategic decisions.
Why Opt for This Calculator for CanSino Biologics Inc. (6185HK)?
- Precision: Utilizes authentic financial data for impeccable accuracy.
- Adaptability: Built for users to effortlessly test and adjust parameters.
- Efficiency: Avoid the complexities of creating a DCF model from the beginning.
- Expert-Level: Crafted with the precision and usability expected at the CFO level.
- Intuitive: Simple to navigate, even for individuals with limited financial modeling knowledge.
Who Should Utilize This Product?
- Professional Investors: Develop comprehensive and accurate valuation models for portfolio assessment related to CanSino Biologics Inc. (6185HK).
- Corporate Finance Teams: Evaluate valuation scenarios to inform internal strategies for CanSino Biologics Inc. (6185HK).
- Consultants and Advisors: Deliver precise valuation insights to clients regarding CanSino Biologics Inc. (6185HK).
- Students and Educators: Leverage real-world data for hands-on practice and teaching in financial modeling using CanSino Biologics Inc. (6185HK).
- Biotech Enthusiasts: Gain insights into how biotech firms like CanSino Biologics Inc. (6185HK) are valued in the market.
What the Template Includes
- Pre-Filled Data: Features CanSino Biologics Inc.'s historical financial performance and projections.
- Discounted Cash Flow Model: A modifiable DCF valuation model equipped with automatic calculations.
- Weighted Average Cost of Capital (WACC): A specific worksheet for determining WACC using tailored inputs.
- Key Financial Ratios: Assess CanSino's profitability, efficiency, and leverage metrics.
- Customizable Inputs: Easily adjust revenue growth, profit margins, and tax rates.
- Clear Dashboard: Visual graphs and tables that summarize essential valuation outcomes.
Disclaimer
All information, articles, and product details provided on this website are for general informational and educational purposes only. We do not claim any ownership over, nor do we intend to infringe upon, any trademarks, copyrights, logos, brand names, or other intellectual property mentioned or depicted on this site. Such intellectual property remains the property of its respective owners, and any references here are made solely for identification or informational purposes, without implying any affiliation, endorsement, or partnership.
We make no representations or warranties, express or implied, regarding the accuracy, completeness, or suitability of any content or products presented. Nothing on this website should be construed as legal, tax, investment, financial, medical, or other professional advice. In addition, no part of this site—including articles or product references—constitutes a solicitation, recommendation, endorsement, advertisement, or offer to buy or sell any securities, franchises, or other financial instruments, particularly in jurisdictions where such activity would be unlawful.
All content is of a general nature and may not address the specific circumstances of any individual or entity. It is not a substitute for professional advice or services. Any actions you take based on the information provided here are strictly at your own risk. You accept full responsibility for any decisions or outcomes arising from your use of this website and agree to release us from any liability in connection with your use of, or reliance upon, the content or products found herein.