|
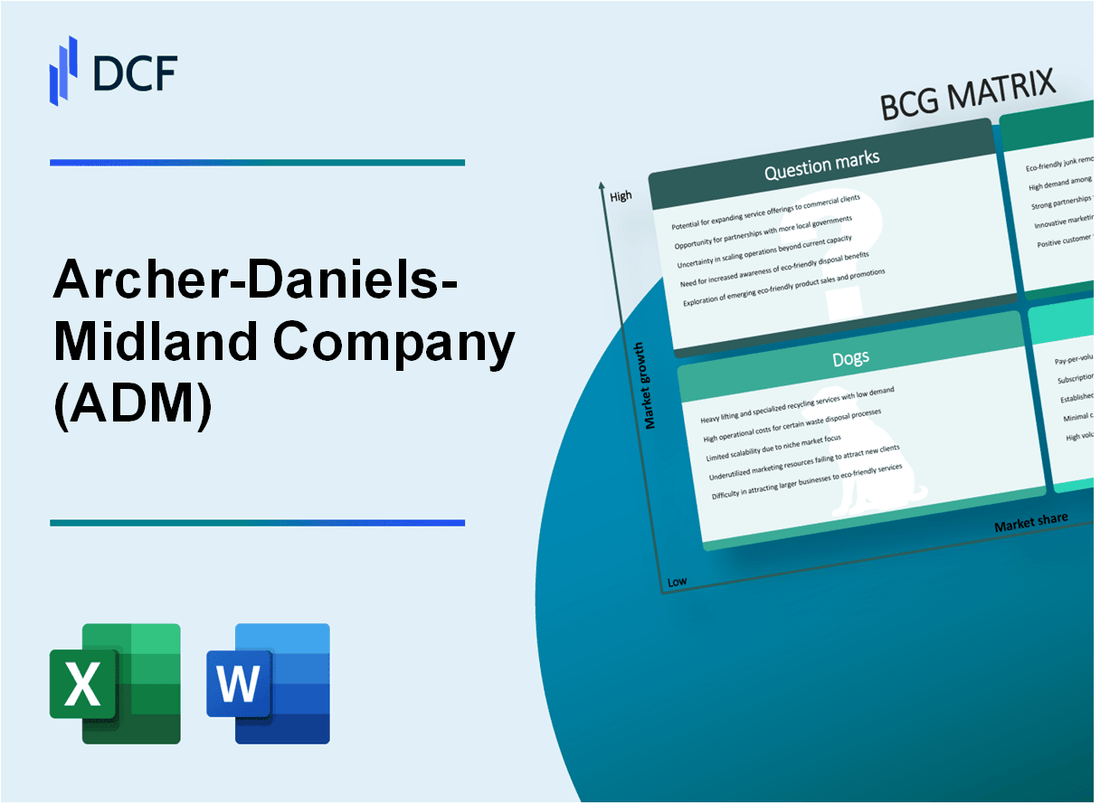
Archer-Daniels-Midland Company (ADM): BCG Matrix [Dec-2025 Updated] |
Fully Editable: Tailor To Your Needs In Excel Or Sheets
Professional Design: Trusted, Industry-Standard Templates
Investor-Approved Valuation Models
MAC/PC Compatible, Fully Unlocked
No Expertise Is Needed; Easy To Follow
Archer-Daniels-Midland Company (ADM) Bundle
Honestly, when you look at Archer-Daniels-Midland Company (ADM) right now, you see a classic portfolio pivot: they're funding a high-growth future with today's massive commodity cash flow. The Nutrition segment is a clear Star, with Q3 2025 operating profit surging 24% to $130 million, but that growth is being bankrolled by the Ag Services and Oilseeds Cash Cow, which generated $5.8 billion in year-to-date operating cash flow. The real strategic challenge is how they manage the Dogs-like the Starches and Sweeteners subsegment, where Q3 profit plunged 36%-and whether the high-potential BioSolutions Question Mark can deliver before the overall $3.25 to $3.50 adjusted EPS outlook for 2025 forces a defintely deeper cut.
Background of Archer-Daniels-Midland Company (ADM)
Archer-Daniels-Midland Company (ADM) is a global powerhouse in agricultural processing and food ingredient solutions, a company that has been connecting crops to markets worldwide since its founding in 1902. It's a foundational player in the global food supply chain, transforming staple agricultural products-like corn, wheat, and oilseeds-into ingredients for food, animal feed, industrial, and energy uses.
ADM operates across a massive global network, managing over 270 processing plants and 420 crop procurement facilities, which is how they maintain their market influence. For the twelve months ending September 30, 2025, the company reported a trailing 12-month revenue of approximately $83.2 billion. Still, the company is navigating a challenging environment, which led management to revise its full-year 2025 adjusted earnings per share (EPS) guidance to a range of $3.25 to $3.50.
The business is structured into three primary segments, each playing a distinct role in the company's overall strategy and financial performance:
- Ag Services and Oilseeds: Handles the procurement, storage, and processing of oilseeds (like soybeans and canola) and grains, producing vegetable oils and protein meals.
- Carbohydrate Solutions: Focuses on wet and dry milling of corn and wheat to produce sweeteners, starches, flours, and ethanol.
- Nutrition: The high-growth, high-margin division that provides a diverse portfolio of ingredients, including flavors, specialty proteins, and functional ingredients for both human and animal nutrition.
This structure shows a deliberate pivot toward higher-margin, value-added products in the Nutrition segment, while maintaining the essential, but often cyclical, scale of the core commodity businesses. To be fair, managing a global commodity giant means facing constant headwinds from trade policy and biofuel uncertainty, which is exactly why the 2025 outlook was tightened.
Archer-Daniels-Midland Company (ADM) - BCG Matrix: Stars
The Nutrition segment is the clear 'Star' for Archer-Daniels-Midland Company, demonstrating high market share in the growing functional ingredients market. This segment is the primary engine for future earnings growth, even as ADM's legacy commodity businesses face volatility.
This business unit commands significant capital investment because its high-growth trajectory requires continuous support for innovation, product placement, and capacity expansion. It is currently generating substantial cash flow, but this cash is immediately reinvested to maintain its leading position in high-demand areas like flavors and specialty health ingredients (postbiotics and biotics).
Nutrition Segment: High-Growth, High-Margin Functional Ingredients
ADM's strategic pivot toward high-margin, functional ingredients is paying off, positioning the Nutrition segment as the company's most dynamic business. This is where ADM has established a strong market lead in areas like Human Nutrition (flavors, proteins) and Animal Nutrition (specialty feed and pet food ingredients). The focus here is on specialty products that offer a higher margin profile than the bulk agricultural commodities in other segments.
This segment's growth is essential for ADM's overall performance, especially since other core segments like Ag Services & Oilseeds and Carbohydrate Solutions faced headwinds in 2025. The Nutrition business is defintely where the company is building its long-term competitive moat.
Q3 2025 Operating Profit Surged 24% to $130 Million
The financial results for the third quarter of 2025 highlight the segment's 'Star' status, delivering impressive growth that contrasts sharply with the broader market. The Nutrition segment's operating profit reached $130 million in Q3 2025, representing a strong year-over-year increase of 24%. Revenue for the segment also grew by 5% to approximately $1.9 billion for the quarter.
Here's the quick math on the sub-segment performance, which shows the depth of this growth:
| Nutrition Sub-Segment | Q3 2025 Operating Profit | Year-over-Year Change |
|---|---|---|
| Human Nutrition | $96 million | Up 12% |
| Animal Nutrition | $34 million | Up 79% |
| Total Nutrition Segment | $130 million | Up 24% |
The massive 79% surge in Animal Nutrition operating profit was driven by a successful shift toward specialty, higher-margin ingredients and ongoing cost optimization efforts.
Receives High Proportion of Capital Expenditure for Organic Growth
As a classic 'Star,' the Nutrition segment is a major consumer of capital expenditure (CapEx). ADM's strategy involves prioritizing selective strategic investments with strong return potential, and a high proportion of the company's total CapEx is earmarked for organic growth within Nutrition. This investment is focused on expanding capacity and driving innovation in key areas:
- Expanding flavor systems production, particularly in North America.
- Increasing capacity for biotics and postbiotics, meeting rising consumer health demand.
- Optimizing the specialty protein portfolio, including the re-opened Decatur East protein plant, expected to contribute an additional $20 million to $25 million per quarter.
Engine for Future High Single-Digit Percentage Earnings Growth
The company views the Nutrition segment as the foundation for its long-term financial targets. While the full-year 2025 adjusted earnings per share (EPS) guidance was revised to a range of $3.25 to $3.50 per share due to external pressures on commodity businesses, the Nutrition segment's performance provides a counter-cyclical buffer and a path to higher future returns. The long-term strategic goal is for this segment to be the primary driver of high single-digit percentage annualized earnings growth. This is why you invest in a Star: you accept the high cash burn today for the promise of a high-return 'Cash Cow' tomorrow, with ADM having a long-term target of $1.25 billion to $1.5 billion in Nutrition Operating Profit by 2025.
Archer-Daniels-Midland Company (ADM) - BCG Matrix: Cash Cows
You're looking for the bedrock of Archer-Daniels-Midland Company's (ADM) business-the segments that reliably generate cash flow, even in a slower-growth environment. For ADM, that role is definitively filled by its Ag Services and Oilseeds (AS&O) segment. This is the classic Cash Cow: a massive market leader in a mature industry, providing the capital to fund the company's higher-growth ventures like Nutrition.
Ag Services and Oilseeds (AS&O): Core global grain origination and processing.
The AS&O segment is ADM's engine room, encompassing the global origination, merchandising, and transportation of agricultural commodities, plus the crushing of oilseeds like soybeans and canola. It operates in a mature, cyclical market, which is why it fits the low-growth, high-market-share definition of a Cash Cow. Honestly, it's a high-volume, low-margin business, but the sheer scale makes it a cash machine.
Even amid challenging market dynamics in 2025, the segment's scale remains immense. For the third quarter of 2025 alone, the AS&O segment reported a massive revenue of $15.6 billion, up 3.5% year-over-year. This revenue base is the foundation of ADM's financial stability, even though the operating profit for the segment was down 21% to $379 million in Q3 2025, primarily due to a 93% plunge in crushing profits from delayed U.S. biofuel policy clarity.
Generates robust operating cash flow of $5.8 billion year-to-date in 2025.
The primary value of a Cash Cow is the cash it throws off, and AS&O delivers. ADM's total year-to-date cash flows provided by operating activities were a robust $5.8 billion as of September 30, 2025. This impressive figure is a direct result of the high-volume, global operations of the AS&O segment, plus a focus on working capital improvement, like inventory management. Here's the quick math on the cash generation:
- YTD Operating Cash Flow (through Q3 2025): $5.8 billion.
- Cash Flow Before Working Capital Adjustments: $2.1 billion YTD 2025.
- Debt Reduction: ADM reduced its total debt by $1.7 billion in the first nine months of 2025, a clear action funded by this strong cash flow.
Segment revenue remains massive, with Q3 2025 revenue at $15.6 billion.
The sheer size of AS&O's revenue stream underscores its market dominance. While the growth rate is low-typical for a Cash Cow-the volume is what matters. This segment's revenue of $15.6 billion in the third quarter of 2025 makes it the single largest revenue contributor to the entire company. This scale provides a significant competitive moat (economic moat), making it incredibly difficult for smaller competitors to challenge ADM's position.
Provides the capital to fund growth segments and the $2.04 annualized dividend.
The core strategic purpose of a Cash Cow is to fund the rest of the portfolio-the Question Marks and Stars. This cash flow allows ADM to invest in its higher-growth Nutrition segment and maintain its commitment to shareholders. The company's Board of Directors declared a quarterly cash dividend of 51.0 cents per share, which translates to an annualized dividend of $2.04 per share. This is ADM's 376th consecutive quarterly payment, a record of over 94 years of uninterrupted dividends, all underpinned by the reliable cash generation from AS&O.
Its extensive asset network and logistical scale provide a dominant market share.
The true competitive advantage of AS&O isn't just volume; it's the infrastructure. ADM's global network of grain elevators, crushing facilities, and transportation assets (including barges and rail cars) creates a logistical scale that few can match. This extensive asset network ensures a dominant market position in global grain origination and processing. They are defintely a key player in the global food supply chain.
The operational strength is evident even in a tough year, with global crush volumes increasing by 2.2% compared to the prior year quarter, showing they are efficiently running their plants and leveraging their size.
| ADM AS&O Segment (Cash Cow) - Key Financials (YTD Q3 2025) | Amount (USD) | Notes |
| Q3 2025 Segment Revenue | $15.6 billion | Massive revenue base, up 3.5% YoY. |
| YTD Operating Cash Flow (Sept 30, 2025) | $5.8 billion | Total cash provided by operating activities. |
| Q3 2025 Operating Profit | $379 million | Down 21% YoY, reflecting margin pressure in crushing. |
| Annualized Dividend Payout | $2.04 per share | Funded by the segment's consistent cash generation. |
Archer-Daniels-Midland Company (ADM) - BCG Matrix: Dogs
For a seasoned analyst, the 'Dogs' quadrant-low market share in a low-growth market-is where capital goes to languish. At Archer-Daniels-Midland Company (ADM), this category is defined by mature, commoditized businesses facing structural headwinds like policy uncertainty and overcapacity, which is why the firm is actively moving to divest or rationalize these units. These segments are cash traps, plain and simple, and ADM is right to target them for removal.
Carbohydrate Solutions' Starches and Sweeteners (S&S) subsegment.
The Starches and Sweeteners (S&S) subsegment within Carbohydrate Solutions is showing clear signs of 'Dog' status. This business is in a mature market with limited growth, and its profitability is highly susceptible to external pressures. In the third quarter of 2025, the S&S subsegment's operating profit was $293 million, reflecting a significant drop. This decline was driven by lower global demand for sweeteners and starches, plus persisting higher corn costs in the EMEA (Europe, Middle East, and Africa) region due to corn quality issues. The overall Carbohydrate Solutions segment operating profit fell 26% to $336 million in Q3 2025, underscoring the drag from the S&S unit. You can't just wait for a commodity market to fix itself.
Q3 2025 operating profit decreased 36% due to lower global demand.
The core issue for Starches and Sweeteners is a lack of competitive advantage in a low-growth environment, which makes it highly sensitive to market shifts. The subsegment's operating profit decreased by a sharp 36% year-over-year in Q3 2025. This steep decline wasn't just a margin issue; it was a volume problem, too, indicating a low market share in a stagnant or shrinking segment. The continuing high cost of corn in EMEA further squeezed margins, proving that a low-market-share product in a commodity space has little pricing power to pass on cost increases.
Traditional oilseed crushing operations, with Q3 profit plunging 93%.
ADM's traditional oilseed crushing operations, a subsegment of Ag Services & Oilseeds, are also firmly in the 'Dogs' quadrant due to a dramatic collapse in profitability. The Crushing subsegment's operating profit plummeted by an alarming 93% in Q3 2025, reaching only $13 million. This massive drop was a direct result of lower margins, which were caused by muted demand stemming from the deferral of U.S. biofuel policy and ongoing challenges in international trade flows. When a major policy driver stalls, the underlying business-which has high fixed costs-is exposed immediately. Here's the quick math on the Q3 2025 performance for these key 'Dog' areas:
| Business Unit (Q3 2025) | Operating Profit (Millions USD) | Year-over-Year Change | Primary Headwind |
|---|---|---|---|
| Starches & Sweeteners (S&S) | $293 | -36% | Lower global demand, high EMEA corn costs |
| Crushing Subsegment | $13 | -93% | Deferred U.S. biofuel policy, trade flow challenges |
Portfolio streamlining includes over $2 billion in potential divestitures.
ADM's management is a trend-aware realist, recognizing that these 'Dogs' need to be either fixed or, more likely, sold. The company has identified nearly $2 billion in 'portfolio opportunities' for simplification, which includes potential divestitures and closures of underperforming assets. This is part of a broader, multi-year strategic initiative to cut costs by $500 million to $750 million over three to five years. Divesting these low-return assets will free up capital to reinvest in high-growth areas like the Nutrition segment, which is a clear 'Star' for the company. This is a clear, actionable plan.
Struggling parts are being rationalized, like the Kershaw, South Carolina crush plant closure.
The rationalization of struggling parts is already underway, a concrete action that shows ADM is serious about cutting its losses on 'Dogs.' In the spring of 2025, ADM permanently closed its soybean processing facility in Kershaw, South Carolina. This was the smallest of ADM's US soybean plants, with a daily crushing capacity of 50,000 bushels. The closure was a necessary step, as the plant no longer aligned with future operational needs, especially given the industry-wide overcapacity and the pressure on crush margins. This is exactly what you do with a 'Dog': you cut it before it consumes more cash. The ongoing rationalization efforts include:
- Permanently shutting the Kershaw, South Carolina soybean crush plant in 2025.
- Consolidating soy protein production by closing the Bushnell, Illinois facility.
- Targeting $500 million to $750 million in cost reductions over the next few years.
- Identifying assets for divestiture that have deteriorating demand and excess capacity.
Finance: Track the progress of the $2 billion in portfolio simplification opportunities and report on cash flow generation from divestitures by the end of Q1 2026.
Archer-Daniels-Midland Company (ADM) - BCG Matrix: Question Marks
Question Marks represent business units in high-growth markets where Archer-Daniels-Midland Company (ADM) currently holds a low market share. These units are cash consumers-they demand heavy investment to gain traction, but their future is uncertain. For ADM in 2025, this category is defined by high-potential, nascent platforms and core businesses facing significant policy-driven volatility.
BioSolutions Platform (within Carbohydrate Solutions)
The BioSolutions Platform, which sits within the Carbohydrate Solutions segment, is a classic Question Mark. It operates in the high-growth market of bioplastics and biomaterials, which is defintely a long-term trend for ADM. The Global Bioplastics & Biopolymers Market size is valued at approximately $23.81 billion in 2025 and is projected to grow at a Compound Annual Growth Rate (CAGR) of 17.90% through 2034. That's a massive growth curve.
But, ADM's market share is still low because this is a relatively new venture requiring substantial capital expenditure (CapEx) to build out capacity. For example, ADM's joint venture with LG Chem to produce Polylactic Acid (PLA) bioplastics is a major investment. The new facility in Decatur, Illinois, which will produce 75,000 tons of bioplastics annually, is only scheduled for completion in late 2025 or early 2026. Until that capacity is fully operational and capturing market share, it remains a cash-intensive Question Mark. The entire Carbohydrate Solutions segment's operating profit of $336 million in Q3 2025 was down 26% year-over-year, which shows the pressure on the parent segment while new growth areas are still developing.
High-growth potential in sustainable, plant-based products like bioplastics
The strategic value of this platform is its alignment with global sustainability trends, allowing ADM to replace petrochemical ingredients with plant-based feedstock like corn. The core product, Polylactic Acid (PLA), is a biodegradable bioplastic made from corn-based lactic acid, targeting high-demand applications like food containers and water bottles. This is a bet on the future, but it requires patience and sustained investment. You either invest heavily now to turn it into a Star, or you risk losing your seat at the table to competitors like NatureWorks or Braskem.
Here's the quick math on the investment and market potential:
| Metric | Value (2025 Data) | BCG Quadrant Implication |
|---|---|---|
| Global Bioplastics Market Size | $23.81 billion | High Market Growth Rate |
| ADM Bioplastics Capacity (New JV) | 75,000 tons/year | Low Relative Market Share (New Entry) |
| Carbohydrate Solutions Segment Op. Profit (Q3 2025) | $336 million (Down 26% YoY) | Cash Drain on Parent Segment |
Ag Services Crushing: High volatility due to U.S. biofuel policy uncertainty
The Ag Services Crushing subsegment is another form of Question Mark, not because it's new, but because its future profitability is highly dependent on an external, high-growth market (biofuels) where ADM's current returns are low and volatile. The deferral of U.S. biofuel policy decisions has restrained demand for soybean oil and other feedstocks, creating massive uncertainty. This policy risk is the primary reason the crushing subsegment's operating profit plummeted by a staggering 93% in Q3 2025, falling to just $13 million compared to the prior year. This volatility makes it a classic Question Mark-a business unit with high potential (if biofuel policy provides clarity and demand) but currently delivering very low, unstable returns.
The entire company is facing a revised 2025 adjusted EPS of $3.25 to $3.50, reflecting market uncertainty
The uncertainty around these Question Marks-specifically the lower crush margins tied to biofuel policy delays-is directly impacting the company's near-term outlook. ADM revised its full-year 2025 adjusted Earnings Per Share (EPS) guidance downward to a range of $3.25 to $3.50, from a prior forecast of approximately $4.00 per share. This revision highlights the systemic risk carried by these volatile Question Mark segments. The company is actively managing what it can, including targeting $200 million to $300 million in cost savings for 2025, but the external policy environment is the major headwind. You can't control Washington, so you must control your costs.
Requires significant investment and strategic clarity to gain dominant market share
The path forward for these Question Marks is clear: commit or cut. For the BioSolutions Platform, the commitment is already made:
- Fund new capacity: Ensure the 75,000-ton bioplastics facility comes online efficiently.
- Drive adoption: Aggressively market the PLA bioplastic to gain early market share in the 17.90% CAGR market.
For Ag Services Crushing, the action is different, focusing on operational flexibility and advocating for policy clarity. ADM needs the U.S. biofuel policy to provide the demand signals that will elevate pricing, volumes, and margins, turning this volatile unit into a reliable Star. Until then, both are consuming cash and management attention with no guarantee of a Star outcome.
Disclaimer
All information, articles, and product details provided on this website are for general informational and educational purposes only. We do not claim any ownership over, nor do we intend to infringe upon, any trademarks, copyrights, logos, brand names, or other intellectual property mentioned or depicted on this site. Such intellectual property remains the property of its respective owners, and any references here are made solely for identification or informational purposes, without implying any affiliation, endorsement, or partnership.
We make no representations or warranties, express or implied, regarding the accuracy, completeness, or suitability of any content or products presented. Nothing on this website should be construed as legal, tax, investment, financial, medical, or other professional advice. In addition, no part of this site—including articles or product references—constitutes a solicitation, recommendation, endorsement, advertisement, or offer to buy or sell any securities, franchises, or other financial instruments, particularly in jurisdictions where such activity would be unlawful.
All content is of a general nature and may not address the specific circumstances of any individual or entity. It is not a substitute for professional advice or services. Any actions you take based on the information provided here are strictly at your own risk. You accept full responsibility for any decisions or outcomes arising from your use of this website and agree to release us from any liability in connection with your use of, or reliance upon, the content or products found herein.