
|
Archer-Daniels-Midland Company (ADM) DCF Valuation |
Fully Editable: Tailor To Your Needs In Excel Or Sheets
Professional Design: Trusted, Industry-Standard Templates
Investor-Approved Valuation Models
MAC/PC Compatible, Fully Unlocked
No Expertise Is Needed; Easy To Follow
Archer-Daniels-Midland Company (ADM) Bundle
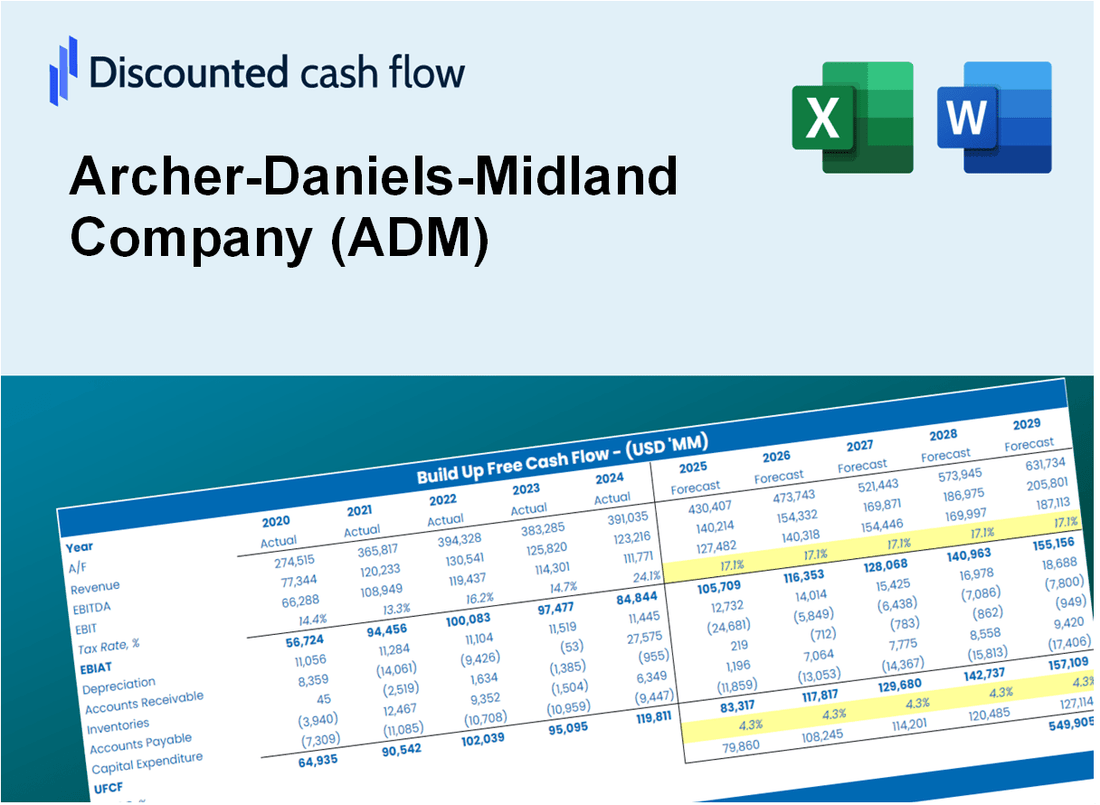
Gain insights into your Archer-Daniels-Midland Company (ADM) valuation analysis using our cutting-edge DCF Calculator! This Excel template comes preloaded with real (ADM) data, enabling you to adjust forecasts and assumptions to accurately determine the intrinsic value of Archer-Daniels-Midland Company.
What You Will Receive
- Customizable Excel Template: A fully adjustable Excel-based DCF Calculator featuring pre-filled real ADM financials.
- Authentic Data: Historical figures and forward-looking projections (highlighted in the yellow cells).
- Forecast Adaptability: Modify forecast parameters such as revenue growth, EBITDA %, and WACC.
- Instant Calculations: Quickly observe how your inputs affect ADM’s valuation.
- Professional Resource: Designed for investors, CFOs, consultants, and financial analysts.
- User-Centric Design: Organized for clarity and simplicity, complete with step-by-step guidance.
Key Features
- Pre-Loaded Data: Archer-Daniels-Midland Company's historical financial statements and pre-filled forecasts.
- Fully Adjustable Inputs: Customize WACC, tax rates, revenue growth, and EBITDA margins.
- Instant Results: View Archer-Daniels-Midland Company's intrinsic value recalculated in real time.
- Clear Visual Outputs: Dashboard charts showcase valuation results and key metrics.
- Built for Accuracy: A professional tool designed for analysts, investors, and finance experts.
How It Works
- Download the Template: Gain immediate access to the Excel-based ADM DCF Calculator.
- Input Your Assumptions: Modify the yellow-highlighted cells for growth rates, WACC, margins, and other parameters.
- Instant Calculations: The model automatically recalculates Archer-Daniels-Midland’s intrinsic value.
- Test Scenarios: Experiment with various assumptions to assess potential changes in valuation.
- Analyze and Decide: Leverage the results to inform your investment or financial analysis.
Why Choose This Calculator for Archer-Daniels-Midland Company (ADM)?
- Comprehensive Tool: Integrates DCF, WACC, and financial ratio analyses tailored for ADM.
- Customizable Inputs: Modify yellow-highlighted cells to explore different financial scenarios for ADM.
- Detailed Insights: Automatically calculates ADM’s intrinsic value and Net Present Value.
- Preloaded Data: Historical and forecasted data specific to ADM ensure accurate starting points.
- Professional Quality: Perfect for financial analysts, investors, and business consultants focusing on ADM.
Who Should Use This Product?
- Agriculture Students: Explore crop valuation techniques and apply them using real market data.
- Researchers: Integrate industry models into academic studies or agricultural research.
- Investors: Validate your investment strategies and assess valuation metrics for Archer-Daniels-Midland Company (ADM).
- Market Analysts: Enhance your analysis with a ready-to-use, customizable financial model.
- Farm Owners: Understand how large agribusinesses like Archer-Daniels-Midland Company (ADM) are evaluated in the market.
What the Template Contains
- Preloaded ADM Data: Historical and projected financial data, including revenue, EBIT, and capital expenditures.
- DCF and WACC Models: Professional-grade sheets for calculating intrinsic value and Weighted Average Cost of Capital.
- Editable Inputs: Yellow-highlighted cells for adjusting revenue growth, tax rates, and discount rates.
- Financial Statements: Comprehensive annual and quarterly financials for deeper analysis.
- Key Ratios: Profitability, leverage, and efficiency ratios to evaluate performance.
- Dashboard and Charts: Visual summaries of valuation outcomes and assumptions.
Disclaimer
All information, articles, and product details provided on this website are for general informational and educational purposes only. We do not claim any ownership over, nor do we intend to infringe upon, any trademarks, copyrights, logos, brand names, or other intellectual property mentioned or depicted on this site. Such intellectual property remains the property of its respective owners, and any references here are made solely for identification or informational purposes, without implying any affiliation, endorsement, or partnership.
We make no representations or warranties, express or implied, regarding the accuracy, completeness, or suitability of any content or products presented. Nothing on this website should be construed as legal, tax, investment, financial, medical, or other professional advice. In addition, no part of this site—including articles or product references—constitutes a solicitation, recommendation, endorsement, advertisement, or offer to buy or sell any securities, franchises, or other financial instruments, particularly in jurisdictions where such activity would be unlawful.
All content is of a general nature and may not address the specific circumstances of any individual or entity. It is not a substitute for professional advice or services. Any actions you take based on the information provided here are strictly at your own risk. You accept full responsibility for any decisions or outcomes arising from your use of this website and agree to release us from any liability in connection with your use of, or reliance upon, the content or products found herein.