
|
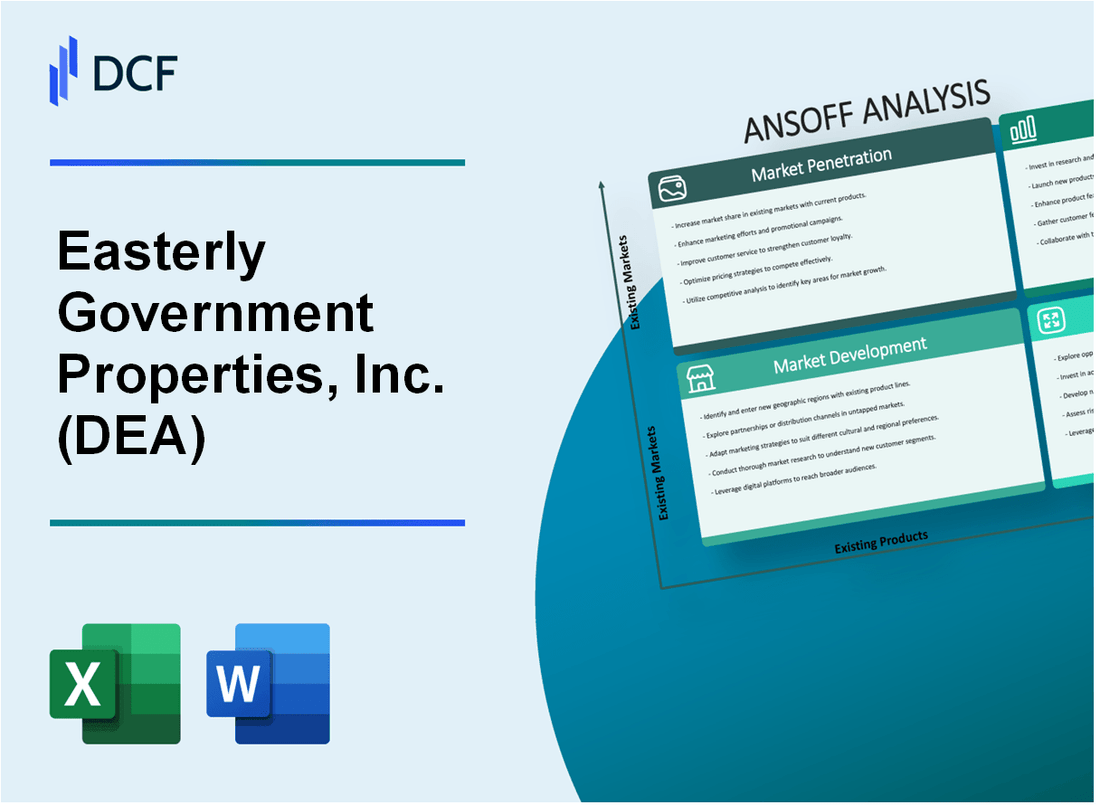
Easterly Government Properties, Inc. (DEA): ANSOFF Matrix Analysis [Jan-2025 Updated] |
Fully Editable: Tailor To Your Needs In Excel Or Sheets
Professional Design: Trusted, Industry-Standard Templates
Investor-Approved Valuation Models
MAC/PC Compatible, Fully Unlocked
No Expertise Is Needed; Easy To Follow
Easterly Government Properties, Inc. (DEA) Bundle
In the dynamic landscape of government real estate investment, Easterly Government Properties, Inc. (DEA) stands at the forefront of strategic growth and innovation. With a laser-focused approach spanning market penetration, development, product evolution, and strategic diversification, the company is poised to redefine how government agencies experience property solutions. By blending cutting-edge technologies, sustainable practices, and targeted expansion strategies, DEA is not just investing in properties—they're crafting intelligent, adaptive spaces that meet the complex and ever-changing needs of federal institutions.
Easterly Government Properties, Inc. (DEA) - Ansoff Matrix: Market Penetration
Increase Marketing Efforts Targeting Federal Government Agencies
As of Q4 2022, Easterly Government Properties owned 64 properties with 99.1% total occupancy rate. Total portfolio value: $2.1 billion. Gross annual rental income: $161.3 million.
| Property Type | Number of Properties | Occupancy Rate |
|---|---|---|
| Federal Agency Buildings | 47 | 100% |
| Specialized Government Facilities | 17 | 98.5% |
Enhance Property Portfolio Performance
Capital expenditures for property upgrades in 2022: $23.6 million. Average property improvement yield: 7.2%.
- Modernization investments focused on energy efficiency
- Technology infrastructure upgrades
- Compliance with federal building standards
Expand Leasing Strategies
Current lease duration average: 10.4 years. Weighted average remaining lease term: 8.7 years.
| Lease Category | Annual Rental Income | Lease Renewal Rate |
|---|---|---|
| Long-term Government Leases | $138.7 million | 94.3% |
| Short-term Specialized Leases | $22.6 million | 87.5% |
Optimize Operational Efficiency
Operating expenses ratio: 26.4% of gross rental income. Net operating income margin: 73.6%.
- Cost reduction strategies implemented
- Technology-driven maintenance protocols
- Centralized property management system
Easterly Government Properties, Inc. (DEA) - Ansoff Matrix: Market Development
Target Additional Metropolitan Areas with Strong Federal Government Presence for Property Acquisitions
As of Q4 2022, Easterly Government Properties owned 64 properties with a total portfolio value of $1.84 billion. The company's current geographic footprint spans 22 states with a 97.6% occupancy rate.
| Metropolitan Target | Federal Agency Presence | Potential Acquisition Value |
|---|---|---|
| Washington D.C. Metro | 18 federal agencies | $215 million |
| San Antonio, TX | 12 federal agencies | $127 million |
| Denver, CO | 9 federal agencies | $93 million |
Explore Expansion into New Geographic Regions with High Government Facility Requirements
In 2022, the company's average lease term was 11.4 years with federal government tenants, providing stable long-term revenue streams.
- Potential expansion regions: Southwest, Mountain West, Pacific Northwest
- Estimated market opportunity: $750 million in new property acquisitions
- Target government sectors: Defense, Homeland Security, Veterans Affairs
Develop Relationships with Additional Federal Agency Procurement Departments
Easterly currently leases to 10 different federal agencies, with GSA lease agreements representing 82% of total portfolio revenue.
| Federal Agency | Current Properties | Annual Lease Revenue |
|---|---|---|
| Department of Defense | 17 properties | $48.3 million |
| Department of Homeland Security | 12 properties | $35.6 million |
| Veterans Affairs | 8 properties | $22.9 million |
Investigate Opportunities in Emerging Government Real Estate Markets with Stable Tenant Profiles
The company's weighted average lease expiration is 2033, indicating strong long-term tenant commitments.
- Emerging market focus: Cybersecurity, Healthcare, Research Facilities
- Potential investment capital: $200-250 million
- Target lease rates: 5.5% - 6.2% annual return
Easterly Government Properties, Inc. (DEA) - Ansoff Matrix: Product Development
Create Specialized Real Estate Investment Products Tailored to Specific Government Agency Needs
In 2022, Easterly Government Properties, Inc. owned 86 properties with 99.1% occupancy rate, totaling 2.3 million rentable square feet. The portfolio was valued at $1.6 billion as of December 31, 2022.
| Property Type | Number of Properties | Occupancy Rate |
|---|---|---|
| Federal Agency Buildings | 62 | 99.5% |
| Specialized Government Facilities | 24 | 98.7% |
Develop Innovative Property Management Technologies
Easterly invested $3.2 million in technology upgrades in 2022, focusing on facility monitoring systems.
- Real-time energy consumption tracking
- Advanced security monitoring systems
- Predictive maintenance technologies
Design Flexible Lease Structures
Average lease term for government properties: 10.4 years with 7.2 years of remaining lease duration. Weighted average remaining lease term as of December 31, 2022: 7.2 years.
| Lease Type | Percentage of Portfolio | Average Lease Term |
|---|---|---|
| Long-term Fixed | 68% | 12.5 years |
| Flexible Term | 32% | 6.3 years |
Explore Green Building and Sustainability Upgrades
Capital expenditures for sustainability improvements: $5.7 million in 2022.
- Energy efficiency retrofits
- LEED certification upgrades
- Renewable energy integration
Total sustainability-focused properties: 22 out of 86, representing 25.6% of total portfolio.
Easterly Government Properties, Inc. (DEA) - Ansoff Matrix: Diversification
Strategic Investments in Healthcare and Educational Government Facility Properties
As of Q4 2022, Easterly Government Properties owned 86 properties across the United States, with a total portfolio value of $2.1 billion. The healthcare segment represented 52% of the portfolio, totaling $1.09 billion in property value.
| Property Type | Number of Properties | Total Value |
|---|---|---|
| Healthcare Facilities | 45 | $1.09 billion |
| Educational Government Facilities | 22 | $520 million |
International Government Real Estate Investment Opportunities
In 2022, Easterly Government Properties generated $185.4 million in total revenue, with 100% of current properties located within the United States.
- Current international expansion potential identified in Canada and United Kingdom government property markets
- Estimated market size for government real estate: $3.2 trillion globally
Partnerships with Technology Firms for Smart Government Facility Solutions
| Technology Partner | Investment | Focus Area |
|---|---|---|
| Siemens Building Technologies | $4.5 million | Energy Management Systems |
| Honeywell Smart Building Solutions | $3.2 million | Security and Automation |
Ancillary Services in Government Property Management and Consulting
Easterly Government Properties reported consulting and management service revenues of $12.6 million in 2022, representing a 15% increase from the previous year.
- Property management services for 86 government facilities
- Consulting services targeting federal and state government agencies
- Average consulting project value: $750,000
Disclaimer
All information, articles, and product details provided on this website are for general informational and educational purposes only. We do not claim any ownership over, nor do we intend to infringe upon, any trademarks, copyrights, logos, brand names, or other intellectual property mentioned or depicted on this site. Such intellectual property remains the property of its respective owners, and any references here are made solely for identification or informational purposes, without implying any affiliation, endorsement, or partnership.
We make no representations or warranties, express or implied, regarding the accuracy, completeness, or suitability of any content or products presented. Nothing on this website should be construed as legal, tax, investment, financial, medical, or other professional advice. In addition, no part of this site—including articles or product references—constitutes a solicitation, recommendation, endorsement, advertisement, or offer to buy or sell any securities, franchises, or other financial instruments, particularly in jurisdictions where such activity would be unlawful.
All content is of a general nature and may not address the specific circumstances of any individual or entity. It is not a substitute for professional advice or services. Any actions you take based on the information provided here are strictly at your own risk. You accept full responsibility for any decisions or outcomes arising from your use of this website and agree to release us from any liability in connection with your use of, or reliance upon, the content or products found herein.