
|
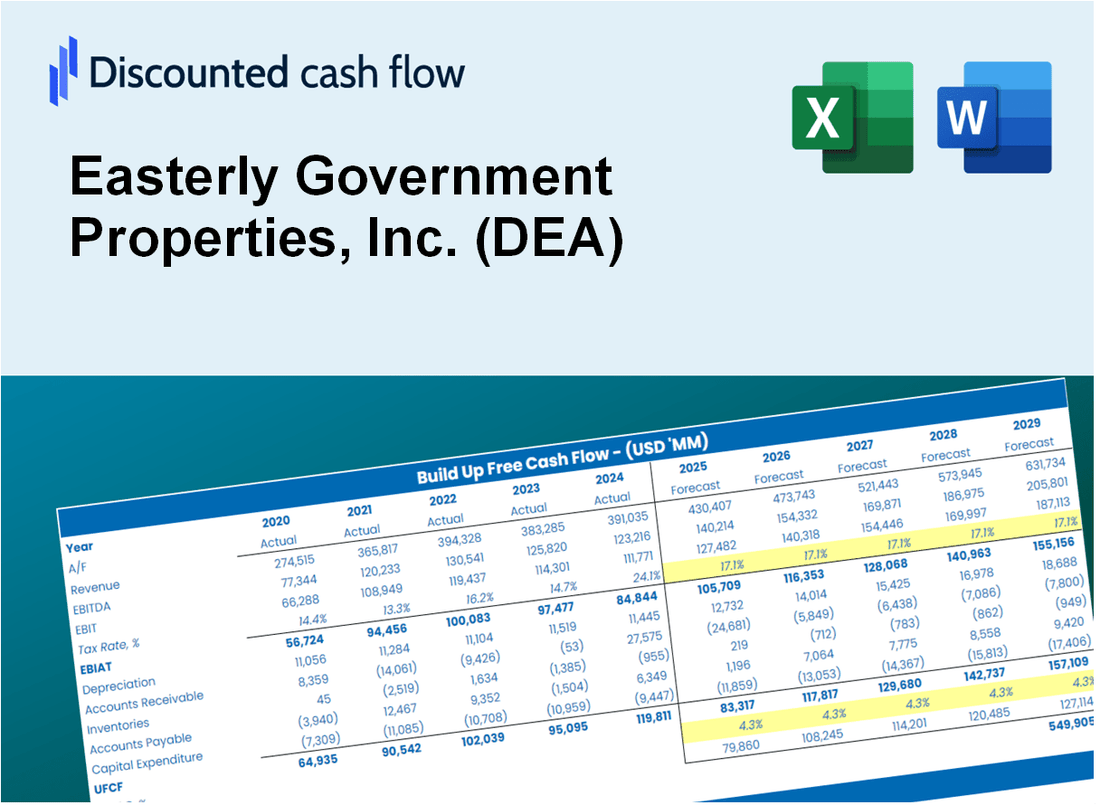
Easterly Government Properties, Inc. (DEA) DCF Valuation |
Fully Editable: Tailor To Your Needs In Excel Or Sheets
Professional Design: Trusted, Industry-Standard Templates
Investor-Approved Valuation Models
MAC/PC Compatible, Fully Unlocked
No Expertise Is Needed; Easy To Follow
Easterly Government Properties, Inc. (DEA) Bundle
Explore the financial outlook of Easterly Government Properties, Inc. (DEA) with our user-friendly DCF Calculator! Enter your projections for growth, margins, and expenses to determine the intrinsic value of Easterly Government Properties, Inc. (DEA) and enhance your investment approach.
What You Will Get
- Editable Forecast Inputs: Easily adjust assumptions (growth %, margins, WACC) to generate various scenarios for Easterly Government Properties, Inc. (DEA).
- Real-World Data: Financial data for Easterly Government Properties pre-filled to accelerate your analysis.
- Automatic DCF Outputs: The template computes Net Present Value (NPV) and intrinsic value automatically.
- Customizable and Professional: A refined Excel model tailored to meet your valuation requirements.
- Built for Analysts and Investors: Perfect for evaluating projections, confirming strategies, and enhancing efficiency.
Key Features
- Customizable Investment Metrics: Adjust essential factors such as rental income growth, occupancy rates, and capital expenditures.
- Instant DCF Valuation: Quickly computes intrinsic value, net present value (NPV), and additional financial metrics.
- High-Precision Accuracy: Leverages Easterly Government Properties' (DEA) real-world financial data for credible valuation results.
- Simplified Scenario Analysis: Effortlessly explore various assumptions and evaluate different outcomes.
- Efficiency Booster: Streamlines the valuation process, removing the need for complex model creation from the ground up.
How It Works
- Step 1: Download the prebuilt Excel template containing Easterly Government Properties, Inc. (DEA) data.
- Step 2: Navigate through the pre-filled sheets to familiarize yourself with the essential metrics.
- Step 3: Modify forecasts and assumptions in the editable yellow cells (WACC, growth, margins).
- Step 4: Instantly observe recalculated results, including Easterly Government Properties, Inc. (DEA)'s intrinsic value.
- Step 5: Utilize the outputs to make informed investment decisions or create detailed reports.
Why Choose This Calculator for Easterly Government Properties, Inc. (DEA)?
- User-Friendly Interface: Tailored for both novices and seasoned professionals.
- Customizable Inputs: Adjust parameters easily to suit your specific analysis.
- Real-Time Feedback: Observe immediate updates to DEA’s valuation as you change inputs.
- Pre-Loaded Data: Comes with Easterly Government Properties’ actual financial metrics for swift evaluations.
- Relied Upon by Experts: Favored by investors and analysts for making well-informed choices.
Who Should Use This Product?
- Investors: Evaluate Easterly Government Properties, Inc.'s (DEA) market performance before making investment decisions.
- CFOs and Financial Analysts: Optimize valuation methods and assess financial forecasts for government properties.
- Real Estate Developers: Understand the valuation metrics used for properties similar to Easterly Government Properties, Inc. (DEA).
- Consultants: Provide comprehensive valuation analyses and reports for clients in the government real estate sector.
- Students and Educators: Utilize current market data to learn and teach valuation principles in real estate.
What the Template Contains
- Comprehensive DCF Model: Editable template featuring detailed valuation calculations tailored for Easterly Government Properties, Inc. (DEA).
- Real-World Data: Historical and projected financials for Easterly Government Properties preloaded for in-depth analysis.
- Customizable Parameters: Modify WACC, growth rates, and tax assumptions to explore various scenarios.
- Financial Statements: Complete annual and quarterly breakdowns for enhanced insights.
- Key Ratios: Integrated analysis for profitability, efficiency, and leverage specific to Easterly Government Properties.
- Dashboard with Visual Outputs: Charts and tables providing clear, actionable results for informed decision-making.
Disclaimer
All information, articles, and product details provided on this website are for general informational and educational purposes only. We do not claim any ownership over, nor do we intend to infringe upon, any trademarks, copyrights, logos, brand names, or other intellectual property mentioned or depicted on this site. Such intellectual property remains the property of its respective owners, and any references here are made solely for identification or informational purposes, without implying any affiliation, endorsement, or partnership.
We make no representations or warranties, express or implied, regarding the accuracy, completeness, or suitability of any content or products presented. Nothing on this website should be construed as legal, tax, investment, financial, medical, or other professional advice. In addition, no part of this site—including articles or product references—constitutes a solicitation, recommendation, endorsement, advertisement, or offer to buy or sell any securities, franchises, or other financial instruments, particularly in jurisdictions where such activity would be unlawful.
All content is of a general nature and may not address the specific circumstances of any individual or entity. It is not a substitute for professional advice or services. Any actions you take based on the information provided here are strictly at your own risk. You accept full responsibility for any decisions or outcomes arising from your use of this website and agree to release us from any liability in connection with your use of, or reliance upon, the content or products found herein.