
|
Darden Restaurants, Inc. (DRI): ANSOFF MATRIX [Dec-2025 Updated] |
Fully Editable: Tailor To Your Needs In Excel Or Sheets
Professional Design: Trusted, Industry-Standard Templates
Investor-Approved Valuation Models
MAC/PC Compatible, Fully Unlocked
No Expertise Is Needed; Easy To Follow
Darden Restaurants, Inc. (DRI) Bundle
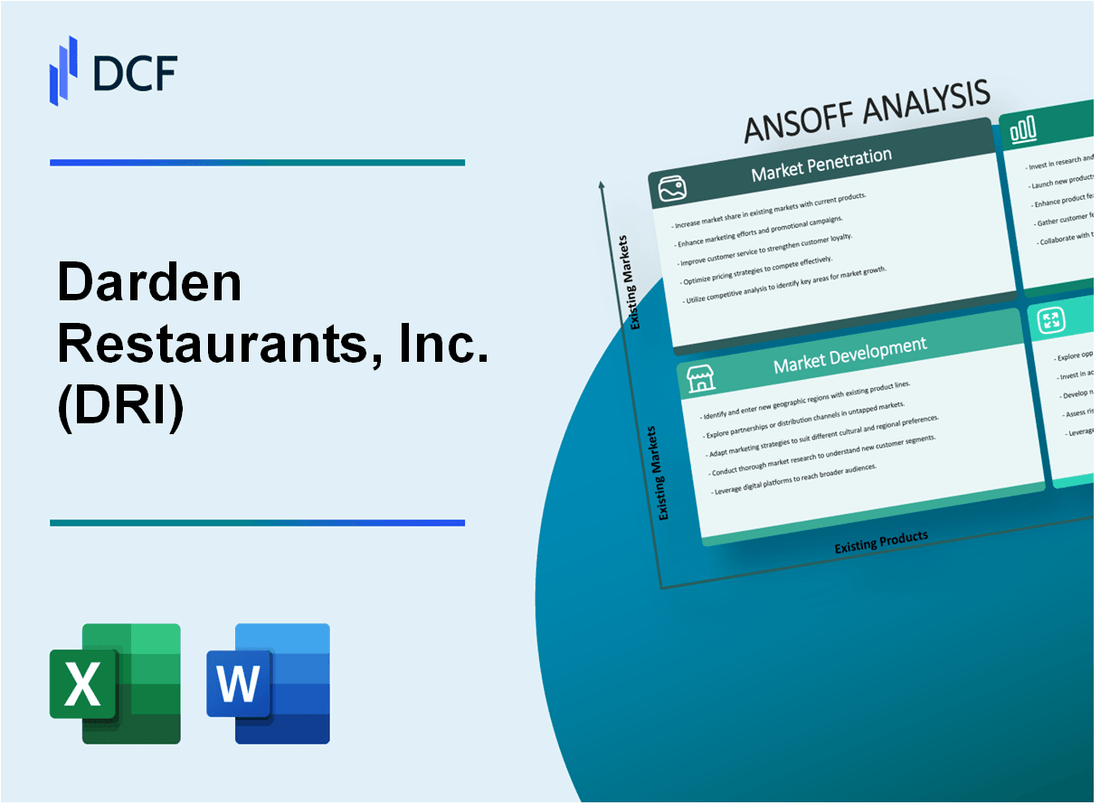
You're looking at Darden Restaurants, Inc.'s (DRI) growth playbook for fiscal 2025, and honestly, it's a masterclass in balancing the known with the unknown, which is exactly what a mature operator should do. We see them digging deep into proven winners-like pushing off-premises sales and aiming to replicate LongHorn Steakhouse's 5.1% same-restaurant sales growth across the portfolio-while simultaneously planting seeds for the future. They are committed to opening 45 to 50 net new restaurants domestically and are even testing the waters with a new fast-casual concept or a strategic breakfast acquisition. I've broken down exactly where their capital and focus are directed across the four Ansoff quadrants, so you can clearly see the near-term execution versus the longer-term diversification gambles. Dive in to see the concrete levers they are pulling right now.
Darden Restaurants, Inc. (DRI) - Ansoff Matrix: Market Penetration
You're looking at how Darden Restaurants, Inc. (DRI) can extract more revenue from its current restaurant footprint and customer base. This is about maximizing sales within the existing system, which is generally the lowest-risk growth quadrant.
Leverage the Olive Garden/Uber Eats partnership to maximize off-premises sales. This move addresses guest demand for convenience, moving smaller, off-premise orders onto a dedicated platform. Olive Garden began testing this exclusive delivery deal using Uber Direct in late 2024, with plans to expand to all roughly 900 outlets by May 2025 after a successful trial. In fiscal Q4 2025, the Uber Direct channel made up about 3.5% of total sales at Olive Garden, with the Uber Direct sales mix being approximately 40 basis points of that total. The delivery check is reported to be 20% higher than traditional small order takeout, providing an immediate sales lift.
Replicate LongHorn Steakhouse's strong performance across the portfolio. LongHorn Steakhouse demonstrated significant strength, posting a 4.0% same-restaurant sales growth in fiscal year 2024. For the most recent reported quarter (Q4 FY2025), LongHorn Steakhouse saw same-restaurant sales growth of 6.7%. The blended same-restaurant sales growth for Consolidated Darden in fiscal year 2024 was 1.6%, which is the baseline to improve upon by driving frequency and check average across all brands.
Drive traffic with value-focused promotions, like the successful return of the 'buy one, take one' deal. This promotion is a direct lever for immediate traffic. For example, Olive Garden's 'buy one, take one' pasta promotion was highlighted in Q4 2025, with prices starting at $14.99. Such value-driven offers are intended to drive traffic and check average, especially when competitors are heavily discounting.
Increase customer frequency by expanding loyalty programs across all 2,100+ US locations. Darden Restaurants, Inc. operates 2,159 restaurants in the United States and Canada as of May 25, 2025. While the company has historically been resistant to a solely points-based loyalty program, leveraging data and insights to better understand the guest is cited as one of its four competitive advantages. Expanding any future loyalty structure across this large base would directly target increased customer frequency.
Regarding utilizing AI-driven dynamic pricing models to optimize revenue from existing customer traffic, Darden Restaurants, Inc. has focused on increasing the average check. For instance, in fiscal year 2024, Olive Garden's U.S. same-restaurant sales increase resulted from a 3.3% increase in average check, partially offsetting a 1.7% decrease in guest counts.
Here's a quick look at the brand performance context for this market penetration strategy:
| Brand/Metric | FY 2024 Total Sales ($ millions) | FY 2024 Same-Restaurant Sales (%) | Q4 FY2025 Same-Restaurant Sales (%) | Company-Owned Locations (As of May 2025) |
|---|---|---|---|---|
| Olive Garden | $5,067.0 | 1.6% | 6.9% | 935 |
| LongHorn Steakhouse | $2,806.2 | 4.7% | 6.7% | 591 |
| Consolidated Darden | $11,390.0 | 1.6% | 4.6% | 2,159 (Total Owned/Operated) |
The focus here is on maximizing existing assets through operational excellence and targeted digital/promotional strategies. The data shows clear success in specific areas, like LongHorn Steakhouse's 4.0% SRS in FY2024 and Olive Garden's recent 6.9% SRS in Q4 FY2025.
The key operational levers for increasing frequency and check within the existing store base include:
- Securing the delivery channel via Uber Direct for Olive Garden, which saw its channel sales mix at 40 basis points in Q4.
- Driving traffic with value offers, such as the $14.99 'buy one, take one' promotion.
- Improving the average check, as seen by Olive Garden's 3.3% average check increase in FY2024.
- Expanding digital ordering capabilities across the 2,159 company-owned locations.
- Achieving margin expansion through cost management, which helped drive LongHorn's segment profit margin to 19.1% in FY2024.
Darden Restaurants, Inc. (DRI) - Ansoff Matrix: Market Development
You're looking at Darden Restaurants, Inc.'s push into new markets, which is the Market Development quadrant of the Ansoff Matrix. This involves taking established brands and introducing them to new geographic areas, or bringing newly acquired brands into Darden's existing operational footprint for wider reach.
For the immediate future, Darden Restaurants, Inc. is planning aggressive unit expansion. While the stated plan in your outline was 45 to 50 net new restaurants in fiscal 2025, the reported results for the end of that period show a strong close to the year. For the fourth quarter of fiscal 2025, Darden added 25 net new restaurants, which included the permanent closure of 22 underperforming restaurants. Looking ahead to fiscal 2026, the company is guiding for 60 to 65 new restaurant openings.
The core brands, Olive Garden and LongHorn Steakhouse, are central to this geographic expansion. Darden's CFO indicated a belief in 'huge opportunity' for LongHorn Steakhouse to open 25 to 30 locations a year and for Olive Garden to open in the 20-ish range annually for the foreseeable future.
Here's a snapshot of the scale of these core brands as of the end of fiscal 2025:
| Brand | Fiscal 2025 Total Sales Amount | End of FY2025 Company-Owned Locations | Fiscal 2025 Q4 Same-Restaurant Sales Growth |
| Olive Garden | $5.2 billion | Over 930 | 6.9% |
| LongHorn Steakhouse | $3.03 billion | Over 590 | 6.7% |
The expansion strategy also leans on optimizing physical footprints. Darden Restaurants is testing smaller, cost-reduced restaurant prototypes for Yard House and Cheddar's Scratch Kitchen. This design shift helps lower the barrier to entry in smaller markets, with construction costs reduced by approximately 15%. Yard House showed strong momentum in Q2 2025, with overall visits up 6.2% and same-store visits up 4.3%.
The acquisition of Chuy's Tex Mex is a direct Market Development play into a new cuisine category. Darden acquired the chain for approximately $605 million. At the time of the acquisition announcement, Chuy's operated 101 restaurants across 15 states. The integration is expected to contribute between $0.12 to $0.15 per share in accretive diluted earnings per share by fiscal 2027. Darden anticipates achieving pretax net synergies of approximately $15 million from the Chuy's integration by the end of fiscal 2026. The Q4 2025 results reflected this, showing the addition of 103 Chuy's restaurants contributing to a 10.6% total sales increase for the quarter.
International Market Development is being executed through franchising, specifically in Canada. On July 14, 2025, Recipe Unlimited acquired all eight existing Olive Garden restaurants in Canada from Darden Restaurants, Inc.. This deal includes a comprehensive development agreement granting Recipe Unlimited the exclusive rights to develop and operate new Olive Garden restaurants throughout Canada.
Key figures related to this Market Development focus include:
- Fiscal 2026 capital spending guidance for new projects is set between $375 million and $400 million.
- The total number of company-owned restaurants across all Darden brands at the end of fiscal 2025 was nearly 2,100.
- Olive Garden's Q4 2025 same-restaurant sales growth of 6.9% outperformed the industry benchmark by 390 basis points.
- The acquisition of Chuy's, which had $450.6 million in revenue in the 12 months ending March 31, 2024, diversifies the portfolio.
Darden Restaurants, Inc. (DRI) - Ansoff Matrix: Product Development
You're looking at how Darden Restaurants, Inc. can push new offerings into its existing restaurant base, which is the core of Product Development on the Ansoff Matrix. The pressure is definitely on, especially in the Fine Dining group.
Introduce new, premium menu items in the Fine Dining segment to reverse the (3.0)% same-restaurant sales decline.
The Fine Dining segment saw its same-restaurant sales decline by (3.0)% for the full Fiscal 2025 year. Looking closer at the fourth quarter of Fiscal 2025, that decline was (3.3)% for the Fine Dining group. For the third quarter of Fiscal 2025, the decline was (0.8)%, and in the second quarter of Fiscal 2025, it was a steeper (5.8)%. This segment's performance contrasts with the consolidated Darden same-restaurant sales growth of 2.0% for the full Fiscal 2025 year.
Expand the use of AI chatbots and advanced data analytics to personalize the guest experience and menu recommendations.
Darden Restaurants, Inc. has integrated AI-powered chatbots to manage reservations and handle menu inquiries. The use of AI algorithms analyzes customer behavior to drive smart menu recommendations. The company has also focused on data-driven menu innovation, as seen with successful promotional campaigns at Olive Garden.
Roll out a new line of ready-to-eat meal kits or branded grocery products based on Olive Garden's most popular items.
There are no publicly reported figures for Darden Restaurants, Inc. rolling out ready-to-eat meal kits or branded grocery products based on Olive Garden items as of the latest reports.
Develop a proprietary, in-house delivery fleet for high-volume urban areas to reduce third-party commission costs.
Darden Restaurants, Inc. expanded its digital footprint through a multi-year partnership with Uber Eats, completing the rollout of Uber Direct delivery across Olive Garden restaurants, with only six locations excluded. Early results show that delivery orders carry higher average checks compared to curbside pickup orders.
Test new technology, like tableside ordering tablets, to improve labor efficiency and guest throughput.
Technology adoption is showing up in the labor line. For the full Fiscal 2025 year, restaurant-level EBITDA grew by 40 basis points. In the fourth quarter of Fiscal 2025, restaurant labor costs were 10 basis points lower year-over-year, as productivity gains offset higher performance-based compensation. Separately, smaller restaurant prototypes for Yard House and Cheddar's Scratch Kitchen have been introduced, cutting construction costs by approximately 15%.
Here are some key financial and operational metrics from the most recent fiscal periods:
| Metric | Fiscal 2025 Full Year | Q4 Fiscal 2025 |
| Total Sales | $12.1 billion | $3.3 billion |
| Consolidated Same-Restaurant Sales Growth | 2.0% | 4.6% |
| Fine Dining Same-Restaurant Sales Change | (3.0)% Decline | (3.3)% Decline |
| Adjusted Diluted EPS from Continuing Operations | $9.55 | $2.98 |
The focus on operational execution is clear in the labor metrics:
- Fiscal 2025 Restaurant-level EBITDA growth: 40 basis points.
- Q4 Fiscal 2025 Restaurant Labor change: 10 basis points lower.
- Yard House and Cheddar's Scratch Kitchen new prototype construction cost reduction: approximately 15%.
The company returned $1.1 billion to shareholders in Fiscal 2025 through dividends of $659 million and share repurchases of $418 million.
Darden Restaurants, Inc. (DRI) - Ansoff Matrix: Diversification
Develop a new fast-casual concept, distinct from Cheddar's Scratch Kitchen, to target the lower-price, quick-service segment.
Cheddar's Scratch Kitchen, part of the Other Business segment, had 181 locations as of May 25, 2025. The company has introduced smaller restaurant prototypes for Yard House and Cheddar's Scratch Kitchen, reducing construction costs by approximately 15% while maintaining brand essence.
Explore strategic alternatives for the Bahama Breeze chain, potentially franchising or selling to focus capital on core growth.
Darden Restaurants, Inc. announced plans to explore strategic alternatives for the Bahama Breeze brand, which may include a sale or conversion of locations to other Darden brands. Darden operates 10 brands in total.
Acquire a regional, high-growth breakfast/brunch chain to enter the morning daypart market.
Darden Restaurants, Inc. completed the acquisition of Chuy's Holdings, Inc. for $649.1 million in an all-cash transaction, or approximately $605 million. This acquisition added 103 net company-owned Chuy's restaurants. The acquisition of Chuy's brought 103 restaurants to the portfolio.
Expand the Ruth's Chris Steak House brand into key international financial hubs via a franchise model.
International franchising opportunities for Ruth's Chris Steak House are available. The Ruth's Chris chain has 155 locations around the globe, including 74 franchised restaurants. The acquisition of Ruth's Chris added 155 locations. Darden views Ruth's Chris as a growth brand with the potential to expand near the high end of its 10% annual growth framework.
Invest in a centralized ghost kitchen model to service multiple brands for delivery-only in dense urban areas.
Olive Garden completed the rollout of Uber Direct delivery across its restaurants, except for 6 locations. New Uber Direct Delivery partnerships were established with both Olive Garden and Cheddar's Scratch Kitchen, which maintain in-restaurant pricing for delivery orders.
The overall Darden portfolio scale as of May 25, 2025, is detailed below, showing the relative size of the brands involved in diversification discussions:
| Segment | Q4 FY2025 Sales (millions) | Key Brand Locations (as of May 25, 2025) |
| Olive Garden | $1,381 | 935 |
| LongHorn Steakhouse | $834 | 591 |
| Fine Dining (incl. Ruth's Chris, Capital Grille, Eddie V's) | $335 | N/A |
| Other Business (incl. Cheddar's, Chuy's, Yard House, Bahama Breeze, Seasons 52) | $722 | 181 Cheddar's |
Darden owned and operated 2,159 restaurants in the United States and Canada as of May 25, 2025. Total sales for Darden Restaurants in fiscal year 2025 were $12,076.7 million.
The company plans capital expenditures between $700 million and $750 million for fiscal 2026. The fiscal 2025 capital spending was approximately $650 million. Darden returned a total of $1.1 billion to shareholders in fiscal year 2025. The Board authorized a new share repurchase program up to $1 billion.
- Darden's long-term framework calls for 10-15% Total Shareholder Return over time.
- Fiscal 2025 diluted net earnings per share from continuing operations was $8.86.
- Fiscal 2026 diluted net earnings per share forecast is between $10.50 and $10.70.
- The company aims to maintain an investment-grade bond rating to ensure flexible access to financing.
- Darden's operating margin was sitting at a 11.4% rate as of late 2023/early 2024.
Disclaimer
All information, articles, and product details provided on this website are for general informational and educational purposes only. We do not claim any ownership over, nor do we intend to infringe upon, any trademarks, copyrights, logos, brand names, or other intellectual property mentioned or depicted on this site. Such intellectual property remains the property of its respective owners, and any references here are made solely for identification or informational purposes, without implying any affiliation, endorsement, or partnership.
We make no representations or warranties, express or implied, regarding the accuracy, completeness, or suitability of any content or products presented. Nothing on this website should be construed as legal, tax, investment, financial, medical, or other professional advice. In addition, no part of this site—including articles or product references—constitutes a solicitation, recommendation, endorsement, advertisement, or offer to buy or sell any securities, franchises, or other financial instruments, particularly in jurisdictions where such activity would be unlawful.
All content is of a general nature and may not address the specific circumstances of any individual or entity. It is not a substitute for professional advice or services. Any actions you take based on the information provided here are strictly at your own risk. You accept full responsibility for any decisions or outcomes arising from your use of this website and agree to release us from any liability in connection with your use of, or reliance upon, the content or products found herein.