
|
Darden Restaurants, Inc. (DRI): BCG Matrix [Dec-2025 Updated] |
Fully Editable: Tailor To Your Needs In Excel Or Sheets
Professional Design: Trusted, Industry-Standard Templates
Investor-Approved Valuation Models
MAC/PC Compatible, Fully Unlocked
No Expertise Is Needed; Easy To Follow
Darden Restaurants, Inc. (DRI) Bundle
You're looking for a clear-eyed view of Darden Restaurants, Inc.'s (DRI) portfolio, and honestly, the fiscal year 2025 numbers tell a compelling story about where the cash is flowing and where the future bets are being placed. LongHorn Steakhouse is clearly the rising Star with 5.1% growth, while the anchor, Olive Garden, keeps the lights on, funding that $1.50 per share quarterly dividend with its steady 1.7% growth. But the picture isn't perfect; the Fine Dining segment is lagging with a (3.0)% sales decline, and newer concepts like Chuy's are the big Question Marks needing serious capital to prove themselves. See the full breakdown of DRI's Stars, Cash Cows, Dogs, and Question Marks below.
Background of Darden Restaurants, Inc. (DRI)
You're looking at Darden Restaurants, Inc. (DRI), a major player in the full-service dining space across the United States and Canada. Founded way back in 1968 and headquartered in Orlando, Florida, Darden Restaurants, Inc. has built its business on a portfolio of well-known casual and fine dining brands. Honestly, their longevity speaks to a solid operating model, even when the consumer spending environment gets choppy.
For the fiscal year ended May 25, 2025, Darden Restaurants, Inc. posted total sales of $12.1 billion, which was a 6.0% increase over the prior fiscal year. That growth was a blend of organic sales and the impact of recent expansion. On the bottom line for that full year, adjusted diluted net earnings per share from continuing operations landed at $9.55, reflecting a 7.5% increase year-over-year. As of that May 2025 date, the company owned and operated 2,159 restaurants in total.
Darden Restaurants, Inc. organizes its operations into four primary reportable segments. These are Olive Garden, LongHorn Steakhouse, Fine Dining (which includes brands like The Capital Grille and Eddie V's), and the Other Business segment. That Other Business segment is quite diverse, housing Cheddar's Scratch Kitchen, Yard House, Seasons 52, and, following a recent strategic move, the newly acquired Chuy's Tex Mex restaurants. To give you a sense of scale, the acquisition of Chuy's added 103 net company-owned restaurants to the portfolio.
Looking at same-restaurant sales for the full fiscal year 2025, the performance across the portfolio was mixed, with a consolidated increase of 2.0%. Olive Garden and LongHorn Steakhouse each posted 1.7% growth in that metric for the full year, while the Fine Dining segment saw a 5.1% jump. Conversely, the Other Business segment experienced a (3.0)% decline in same-restaurant sales for the same period. Still, the momentum carried into the start of fiscal 2026, as Q1 2026 same-restaurant sales showed Olive Garden at 5.9% and LongHorn Steakhouse at 5.5%, though the Fine Dining segment dipped slightly at (0.2)%.
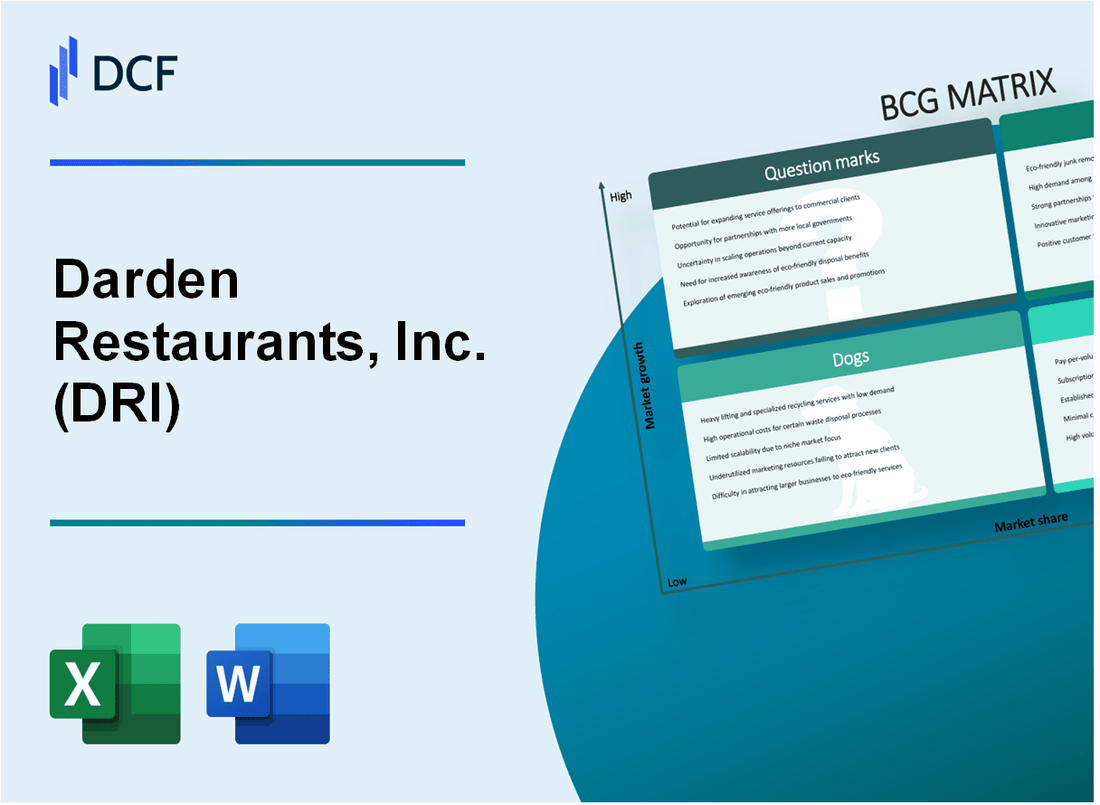
Darden Restaurants, Inc. (DRI) - BCG Matrix: Stars
You're analyzing the portfolio, and right now, LongHorn Steakhouse is clearly the brand demanding the most investment for future growth. It fits the Star profile perfectly: high market share in a segment that's still growing, but it consumes significant cash to maintain that lead and expand.
LongHorn Steakhouse delivered a strong Fiscal Year 2025 performance. Its same-restaurant sales (SRS) growth was 5.1%, which significantly outpaced the Darden Restaurants, Inc. consolidated average SRS growth of 2.0% for the same period. This performance solidifies its position as a leader within the portfolio.
This brand is the company's primary organic growth engine, consistently delivering top-decile industry performance. It operates in a focused, premium-casual niche, and for the first time in Fiscal Year 2025, it crossed $3 billion in total sales. This is a major milestone for the brand.
To support this growth trajectory, LongHorn Steakhouse receives significant capital investment for new unit expansion and operational excellence. As of May 25, 2025, the brand operated 591 locations. This investment is crucial to ensure it can convert its current market leadership into a future Cash Cow when the high-growth market eventually matures.
Here's a look at the key financial metrics that define LongHorn Steakhouse's Star status for the full Fiscal Year 2025:
| Metric | Value |
| Fiscal Year 2025 Same-Restaurant Sales Growth | 5.1% |
| Fiscal Year 2025 Total Sales | $3.0 billion |
| Number of Locations (as of May 25, 2025) | 591 |
| Consolidated Darden FY2025 Same-Restaurant Sales Growth | 2.0% |
The brand's performance across the fiscal year shows its momentum, though quarterly results varied:
- Q4 2025 Same-Restaurant Sales Growth: 6.7%
- Q3 2025 Same-Restaurant Sales Growth: 2.6%
- Q2 2025 Same-Restaurant Sales Growth: 7.5%
Darden Restaurants, Inc. total sales for the full Fiscal Year 2025 reached $12.1 billion, and the adjusted diluted net earnings per share from continuing operations were $9.55. The strategy here is clear: invest heavily in LongHorn Steakhouse to maintain its high market share, which is the defining characteristic of a Star in the BCG framework. If onboarding takes 14+ days, churn risk rises, but for a Star, continued investment in placement and promotion is the required action.
Darden Restaurants, Inc. (DRI) - BCG Matrix: Cash Cows
You're analyzing the core engine of Darden Restaurants, Inc. (DRI), the segment that funds the growth and innovation across the entire portfolio. For a mature, market-leading brand like Olive Garden, the focus shifts from aggressive expansion to maximizing efficiency and milking that strong market position.
Olive Garden stands as the portfolio anchor, consistently generating stable, high cash flow from 935 locations as of May 25, 2025. This scale in a mature segment is what defines a Cash Cow in the Boston Consulting Group Matrix.
The brand delivered a modest but positive Fiscal Year 2025 Same-Restaurant Sales (SRS) growth of 1.7%, which reflects the reality of market maturity but underscores a high relative market share that few competitors can match. Still, this consistent performance is the bedrock of the company's capital allocation strategy.
This foundational cash flow directly supports the company's commitment to shareholders, evidenced by the declared quarterly cash dividend of $1.50 per share, and contributed significantly to the $1.1 billion returned to shareholders in FY2025.
The operational focus here is decidedly on margin maintenance and driving operational efficiency, not on aggressive unit growth. You can see this discipline in the reported segment profit margin of 23% in Q3 FY2025, a clear indicator of high profitability from a high-share asset.
Here's a quick look at the key financial metrics underpinning Olive Garden's Cash Cow status:
- Portfolio anchor with 935 locations as of May 25, 2025.
- FY2025 Olive Garden SRS growth of 1.7%.
- Q3 FY2025 Segment Profit Margin of 23%.
- Supports a quarterly dividend of $1.50 per share.
The strategy for a Cash Cow like Olive Garden is to invest just enough to maintain its competitive edge and efficiency, ensuring it keeps generating surplus cash. Investments are targeted at infrastructure improvements that boost cash flow rather than broad promotional spending.
Consider the scale of the cash generation and shareholder returns:
| Metric | Value | Source Context |
| Total Shareholder Return (FY2025) | $1.1 billion | Total capital returned, including dividends and repurchases. |
| Quarterly Dividend Per Share | $1.50 | Declared amount, reflecting confidence in cash flow durability. |
| Segment Profit Margin (Q3 FY2025) | 23% | Reflects high profitability in a mature market. |
| Total Locations (May 25, 2025) | 935 | Represents the established, high-market-share footprint. |
The goal is to 'milk' these gains passively while funding the riskier Question Marks in the portfolio. This steady performance is what allows Darden Restaurants, Inc. to maintain its long-term Total Shareholder Return framework of 10% to 15% over time.
Finance: draft the projected cash flow contribution from Olive Garden for FY2026 by next Tuesday.
Darden Restaurants, Inc. (DRI) - BCG Matrix: Dogs
You're looking at the brands that aren't pulling their weight, the ones tying up capital without delivering the growth Darden needs. In the BCG framework, these are the Dogs. For Darden Restaurants, Inc., this quadrant is primarily occupied by the Fine Dining segment and the recently de-prioritized Bahama Breeze chain.
The Fine Dining segment, which includes The Capital Grille, Eddie V's, and Ruth's Chris, saw its full-year fiscal 2025 same-restaurant sales (SRS) decline by (3.0)%. This negative growth signals a clear struggle in a market segment where consumers are trading down for value. To be fair, the fourth quarter of fiscal 2025 showed a slightly worse SRS decline of (3.3)%, suggesting the headwinds persisted right through the end of the year, even as some sequential traffic improvements were noted.
Here's a quick look at how the Fine Dining segment stacked up against the rest of the portfolio for the full fiscal year 2025:
| Segment | Full-Year FY2025 Same-Restaurant Sales (SRS) |
| LongHorn Steakhouse | 5.1% |
| Consolidated Darden | 2.0% |
| Olive Garden | 1.7% |
| Other Business | 0.2% |
| Fine Dining | (3.0)% |
The segment faces significant headwinds from cautious high-end consumer spending. Diners are definitely opting for the value proposition found at places like LongHorn Steakhouse, where the average check is substantially lower than at The Capital Grille or Eddie V's. This trend means the high-cost structure of fine dining becomes a liability when traffic is declining. For instance, in the second quarter of fiscal 2025, the segment's SRS decline was even steeper at (5.8)%.
Bahama Breeze is the clearest signal of a Dog asset Darden is actively trying to shed. CEO Rick Cardenas confirmed the brand no longer meets the company's criteria for long-term investment, stating they are not going to be putting a lot of investment into it. This decision followed the abrupt closure of 15 Bahama Breeze locations in May 2025, shrinking the chain's footprint to just 28 remaining units. Darden is now exploring strategic alternatives, which means either a complete sale to a new owner or an internal conversion of the remaining restaurants to other, higher-performing Darden concepts.
These Dog units share common characteristics that justify their classification and the divestiture strategy:
- Fine Dining SRS for FY2025 was (3.0)%.
- Bahama Breeze saw 15 locations closed in May 2025.
- The remaining Bahama Breeze footprint is 28 restaurants.
- The segment/brand requires minimal new capital investment.
- They operate in low-growth or declining market share positions.
Finance: draft the projected cash impact of a Bahama Breeze divestiture by next Tuesday.
Darden Restaurants, Inc. (DRI) - BCG Matrix: Question Marks
You're looking at the Question Marks quadrant of Darden Restaurants, Inc. (DRI) portfolio, which is where high-growth market opportunities meet low current market share. These are the brands that consume cash now, hoping to become tomorrow's Stars. Honestly, it's a high-stakes game of investment versus divestment.
The primary candidates here are the newer, less established, or recently integrated concepts. Take Chuy's Tex Mex, for example. This was a recent acquisition, bringing in 103 restaurants. While Tex-Mex is a high-growth category Darden wanted to enter, the integration track record is still unproven at this scale. It's a big bet on a new cuisine type for the portfolio.
Then there's Cheddar's Scratch Kitchen. While it's a more established brand, it's smaller than the behemoths like Olive Garden, operating around 181 units. Darden Restaurants is actively trying to accelerate its growth by testing new, smaller prototypes. The goal here is clear: reduce the initial cash outlay for new builds, with reports suggesting construction costs are being cut by 15%. You need to see if these smaller footprints can capture market share efficiently.
The uncertainty surrounding these growth bets is often masked when you look at the bigger picture. For instance, the 'Other Business' segment, which houses these Question Marks along with others, reported a blended fiscal year 2025 Same-Store Sales (SRS) growth of only 0.2%. That low blended number tells you that while some brands in that group are performing well, the overall segment is volatile and uncertain, likely due to the cash burn or integration costs associated with these high-potential, low-share concepts.
Here's a quick look at the strategic imperative for these units:
- These brands require heavy investment to quickly gain share.
- They consume cash but lack the established returns of Cash Cows.
- Failure to gain traction quickly risks them sliding into the Dog quadrant.
- The decision is simple: invest heavily or plan to sell.
The required investment is substantial, as Darden Restaurants plans for 60-65 total new openings in fiscal year 2026. A significant portion of that capital expenditure, which was forecasted to be $375-$400 million for new projects in FY2026, must be allocated here to determine if Chuy's and the newly prototyped Cheddar's can become Stars.
Here is a comparison of the unit scale and cost-saving efforts for the brands positioned as Question Marks:
| Brand | Approximate Unit Count (FY2025/2026 Est.) | Key Growth/Investment Strategy | Cost Reduction Metric |
| Chuy's Tex Mex | 103 acquired restaurants | High-growth market entry via acquisition. | Unproven integration track record. |
| Cheddar's Scratch Kitchen | 181 units | Testing new, smaller prototypes for scale. | 15% reduction in construction costs |
Finance: draft the capital allocation breakdown for the FY2026 new openings by Friday.
Disclaimer
All information, articles, and product details provided on this website are for general informational and educational purposes only. We do not claim any ownership over, nor do we intend to infringe upon, any trademarks, copyrights, logos, brand names, or other intellectual property mentioned or depicted on this site. Such intellectual property remains the property of its respective owners, and any references here are made solely for identification or informational purposes, without implying any affiliation, endorsement, or partnership.
We make no representations or warranties, express or implied, regarding the accuracy, completeness, or suitability of any content or products presented. Nothing on this website should be construed as legal, tax, investment, financial, medical, or other professional advice. In addition, no part of this site—including articles or product references—constitutes a solicitation, recommendation, endorsement, advertisement, or offer to buy or sell any securities, franchises, or other financial instruments, particularly in jurisdictions where such activity would be unlawful.
All content is of a general nature and may not address the specific circumstances of any individual or entity. It is not a substitute for professional advice or services. Any actions you take based on the information provided here are strictly at your own risk. You accept full responsibility for any decisions or outcomes arising from your use of this website and agree to release us from any liability in connection with your use of, or reliance upon, the content or products found herein.