
|
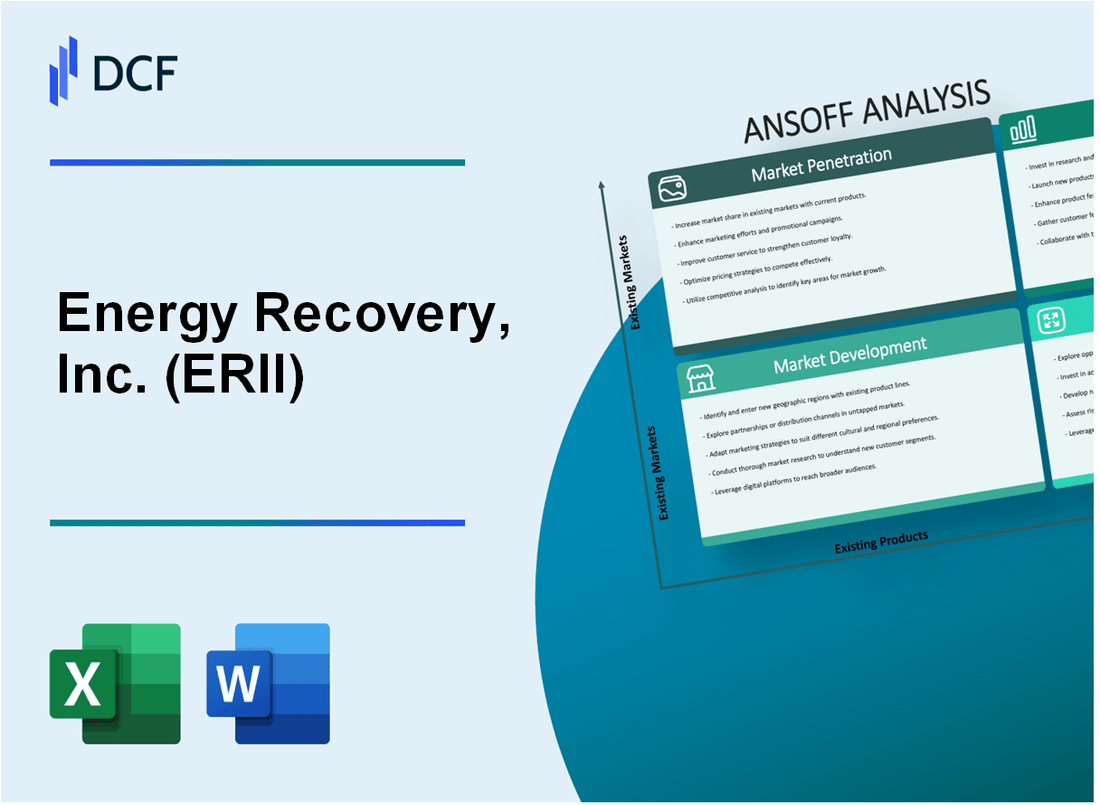
Energy Recovery, Inc. (ERII): ANSOFF MATRIX [Dec-2025 Updated] |
Fully Editable: Tailor To Your Needs In Excel Or Sheets
Professional Design: Trusted, Industry-Standard Templates
Investor-Approved Valuation Models
MAC/PC Compatible, Fully Unlocked
No Expertise Is Needed; Easy To Follow
Energy Recovery, Inc. (ERII) Bundle
You're looking for a clear, actionable roadmap to drive growth for Energy Recovery, Inc., and after two decades analyzing tech firms, I can tell you the Ansoff Matrix is the best lens for this. We're mapping their proven PX Pressure Exchanger technology across four paths-from doubling down in the Middle East, which drove 60% of their 2024 revenue, to pushing the next-generation PX launched in Q2 2025 into new wastewater verticals. Honestly, with Q3 2025 revenue hitting $32.0 million and $14.09 million reinvested into R&D, the foundation is solid, but the next move is critical. Here's the quick math: the biggest near-term wins are likely in Market Penetration and Product Development. Dive below to see the specific actions we need to see Energy Recovery, Inc. execute right now.
Energy Recovery, Inc. (ERII) - Ansoff Matrix: Market Penetration
You're looking at how Energy Recovery, Inc. (ERII) can sell more of its existing Pressure Exchanger (PX) products into its current markets, which is the core of Market Penetration. This strategy relies heavily on product longevity and recent financial strength to win big, established deals.
The foundation for deeper penetration is the product's proven durability. Energy Recovery, Inc. announced in February 2025 that rigorous internal testing validated the PX Pressure Exchanger (PX) energy recovery device now has a 30-year design life, a five-year increase from the previously published 25-year design life. This reinforces the reliability of the over 35,000 PX devices already deployed in demanding environments. This extended life is a major selling point for securing long-term Original Equipment Manufacturer (OEM) agreements.
Here are the specific actions driving this market penetration strategy:
- Capitalize on the PX's new 30-year design life to secure long-term OEM contracts.
- Target the Middle East and Africa, which generated 62.55% of 2024 revenue, with the PX Q400 for mega-projects.
- Increase aftermarket (AM) sales by promoting the PX's high efficiency to existing plant operators.
- Leverage the Q3 2025 revenue of $32.0 million to show financial stability in bidding for large desalination projects.
- Offer competitive financing for the next-generation PX product launched in Q2 2025 to accelerate adoption.
The focus on the Middle East and Africa is clear, supported by recent contract wins. For instance, Energy Recovery, Inc. announced significant project wins in Saudi Arabia in November 2025 totaling $32.8 million, and prior to that, reported contract awards in September 2025 for projects in Qatar totaling approximately $31 million. These large deals in the core desalination market demonstrate traction in the targeted region.
To support these large bids, you need to show financial muscle. The reported revenue for the third quarter ending September 30, 2025, was $32.0 million, although this represented a decrease of $6.6 million compared to Q3 2024. Still, the balance sheet provides comfort; cash and investments stood at $79.9 million as of September 30, 2025. This level of liquidity helps assure large project bidders of the company's staying power.
For aftermarket sales, the core message is operational savings. While the exact efficiency number of 98% isn't confirmed in the latest reports, the general value proposition is clear: the PX technology generates cost savings and increases energy efficiency. The discussion around the next-generation PX product, following the Q2 2025 revenue of $28.1 million, suggests management is focused on maintaining market share through innovation, potentially using financing incentives to speed up the adoption of the new platform.
Here is a snapshot of the key figures underpinning this Market Penetration push:
| Metric | Value/Percentage | Period/Context |
| PX Design Life Extension | 30-year (up from 25-year) | Announced Feb 2025 |
| Deployed PX Units | Over 35,000 | Context for Aftermarket Sales |
| Middle East & Africa Revenue Share | 62.55% | FY 2024 |
| Q3 2025 Revenue | $32.0 million | Period Ending September 30, 2025 |
| Cash & Investments | $79.9 million | As of September 30, 2025 |
| Saudi Arabia Contract Value | $32.8 million | Announced Nov 2025 |
| Qatar Contract Value | Approx. $31 million | Announced Sep 2025 |
| Q2 2025 Revenue | $28.1 million | Period Ending June 30, 2025 |
The focus on existing customers and core regions means you're pushing proven tech where you already have a footprint. Finance: draft 13-week cash view by Friday.
Energy Recovery, Inc. (ERII) - Ansoff Matrix: Market Development
You're looking at Energy Recovery, Inc. (ERII) and seeing a clear path for growth by taking existing Pressure Exchanger (PX) technology into new markets and geographies. This Market Development strategy hinges on execution in specific areas, and we have some numbers to frame the opportunity.
Aggressively build reference cases for the Ultra PX™ in the five key wastewater verticals (e.g., municipal, mining).
The foundation for this is strong; as of February 2025, over 35,000 PX devices have been deployed across seawater desalination and industrial wastewater applications, proving the core technology's durability. Management noted in Q2 2025 that they have 'broadened our reference case list' for wastewater, signaling an active push to build out the necessary proof points for the Ultra PX family in these new verticals. You need to see concrete wins here to de-risk the investment thesis for this segment.
Expand core desalination sales into the Americas and Europe, which currently account for a small portion of revenue.
To understand the scale of this expansion, look at the geographic revenue split from the end of 2024. The core business is heavily weighted elsewhere, meaning the Americas and Europe represent significant untapped potential for the existing desalination technology.
| Region | 2024 Revenue Percentage |
| Middle East and Africa | 62.55% |
| Asia | 24.88% |
| Europe | 6.36% |
| Americas | 6.21% |
For the nine months ended September 30, 2025, Energy Recovery, Inc. reported total revenue of $68.1 million, and the consensus 2025 revenue estimate was around $83.1 million or potentially $150.85 million, showing the lumpy nature of project timing. The goal here is to shift that 6.36% (Europe) and 6.21% (Americas) contribution upward by pushing established desalination PX sales into these regions.
Focus sales execution on China and India for wastewater treatment, where industrial demand is rising.
This focus is strategic but has faced headwinds. In Q1 2025, management was actively exploring alternative markets because guidance for the wastewater segment was uncertain due to tariff implications, particularly concerning China. This is a market where Energy Recovery, Inc. previously secured industrial wastewater treatment contracts totaling $885K across China and India back in February 2022. The current action is about regaining momentum after the tariff uncertainty, aiming to capitalize on rising Zero Liquid Discharge (ZLD) and Minimum Liquid Discharge (MLD) mandates in these industrial hubs.
Secure initial commercial deployments of the Ultra PX™ in Ultra High-Pressure Reverse Osmosis (UHPRO) applications.
This is about moving a specific product variant, the Ultra High-Pressure PX, from development or pilot stages to revenue-generating deployments. This technology is designed to address key challenges in energy intensity within high-pressure RO systems. You need to track the first revenue recognition from these initial commercial deployments to confirm market acceptance of this specialized hardware.
Partner with global engineering firms to integrate the PX into new regional desalination plant designs.
While the most concrete partnership data available relates to the Emerging Technologies segment, the strategy is clearly in play. For instance, in the CO2 segment, Energy Recovery, Inc. has an MOU with Hill Phoenix and has discussed integration testing milestones expected to support broader deployment by the end of 2025. This signals a clear intent to embed the PX technology directly into the designs created by major engineering, procurement, and construction (EPC) firms for new regional desalination projects, rather than just being specified after the fact. The company ended Q2 2025 with $93.7 million in cash and investments, providing the financial runway to support these deeper integration efforts.
- Build reference cases for Ultra PX in five wastewater verticals.
- Expand desalination sales penetration in Europe and the Americas.
- Target China and India for industrial wastewater treatment growth.
- Achieve first commercial sales for the Ultra High-Pressure PX.
- Secure integration agreements with global engineering firms.
Finance: draft 13-week cash view by Friday.
Energy Recovery, Inc. (ERII) - Ansoff Matrix: Product Development
You're looking at how Energy Recovery, Inc. (ERII) plans to drive growth by introducing new products into its existing markets, which is the Product Development quadrant of the Ansoff Matrix. This strategy builds on the foundation of their existing installed base, which includes over 35,000 PX devices deployed.
A key near-term focus is driving adoption of the next-generation PX product for desalination, which you are planning to launch in Q2 2025, promising higher operational efficiency than previous models. This follows a period where the company reported Q3 2025 revenue of $32.0 million and net income of $3.9 million.
You are also earmarking significant investment for product enhancement. The plan is to invest the $14.09 million Q3 2025 R&D spend into further enhancing the Ultra PX™ for industrial wastewater applications. The Ultra PX already recovers up to 60 percent of wasted energy in Ultra High-Pressure Reverse Osmosis (UHPRO) systems.
Here's a look at the performance metrics that make these product enhancements worthwhile:
| Metric | PX Technology Benchmark | Unit/Value |
| Design Life Extension | 30-year design life (up from 25-year) | Years |
| Ultra PX Peak Efficiency | 97% | Percent |
| Ultra PX Max Pressure | 120 bar (1,740 psi) | Pressure |
| Low-Pressure PX Minimum Flow | 30 gpm (6.8 m3/h) | Flow Rate |
To capture more of the brackish water market, the next step is to develop a modular, smaller-scale PX unit specifically for Brackish Water Reverse Osmosis (BWRO) applications. This contrasts with the larger desalination projects, like the ones in Spain announced in May 2025, which secured over $7 million in contracts and are projected to save 280.5 GWh/year.
You're also looking to increase the value of the Aftermarket segment. The strategy here is to integrate advanced sensors into the PX units to offer predictive maintenance services. For context, Aftermarket revenue in Q3 2025 was $4.638 million, flat compared to Q3 2024.
Finally, to offer a more complete package to customers, the plan includes introducing a high-pressure pump line complementary to the PX. This aims to offer a single-source solution for the entire power train. This move supports the overall revenue base, which saw Q3 2025 Adjusted EBITDA of $6.8 million.
The planned product extensions include:
- Drive adoption of the next-generation PX for desalination.
- Invest R&D into enhancing the Ultra PX™ for industrial wastewater.
- Develop a modular, smaller-scale PX for BWRO.
- Integrate sensors for predictive maintenance services.
- Introduce a complementary high-pressure pump line.
Operating expenses for the quarter were $16.9 million, a decrease of 6.4% versus Q3 2024, partly due to reduced development costs in the Emerging Technologies segment. Finance: draft the capital allocation plan for the $14.09 million R&D spend by next Wednesday.
Energy Recovery, Inc. (ERII) - Ansoff Matrix: Diversification
You're looking at how Energy Recovery, Inc. (ERII) can expand beyond its established water markets, which is the essence of diversification here. The strategy hinges on pushing the core pressure exchanger (PX) technology into new, adjacent spaces, primarily CO2 refrigeration, while keeping a tight leash on spending in that segment.
Focusing CO2 Commercialization with OEM Partners
The commercialization path for the PX G1300™ is clearly mapped through Original Equipment Manufacturers (OEMs). Energy Recovery, Inc. has been gathering significant feedback from these partners on real-world operations, ease of installation, and the value proposition, which is crucial for establishing market success. The company expects its sales process to organically evolve once the PX G1300 is established in the market, relying primarily on these OEMs to build and install systems for end users. This focus is on building a strong foundation with the established players in the refrigeration space.
The CO2 business rollout has been slower than initially hoped, leading to a necessary pivot in capital allocation. Still, OEM engagement remains strong, and the company is focused on gaining traction in 2026, with plans to provide clear updates on progress in the fourth quarter of 2025.
Prioritizing High-Heat Load Pilot Projects
To prove the value proposition in the most demanding environments, pilot projects for the PX G1300™ are prioritized in high-heat load regions. The technology is designed to combat the 'Achilles Heel' of CO2 refrigeration-efficiency decline in hot weather. Field data and whitepapers show that the PX G1300 has the potential to increase cooling capacity by up to 15% when operating at ambient temperatures around 35°C/95°F. This capacity boost helps safeguard against system downtime during heat waves.
Here's a quick look at the performance metrics Energy Recovery, Inc. is using to drive adoption in these critical pilots:
| Metric | Observed/Projected Performance | Context |
|---|---|---|
| Peak Coefficient of Performance (COP) Increase | Up to 30% | Energy efficiency improvement |
| Projected Annualized Energy Savings | Up to 15% or more | Compared to systems without the device |
| Cooling Capacity Increase at 95°F (35°C) | Up to 15% | Crucial for high-heat load regions |
| Average Energy Consumption Cut | Approximately 14% | In one supermarket pilot, on top of an adiabatic cooler |
| Peak Power Consumption Reduction | Roughly 30% | In one pilot, by eliminating the intermittent onset of a third compressor |
The PX G1300 has accumulated more than 25,000 operational hours across multiple sites in the United States and Europe.
Managing OpEx in Emerging Technologies
Given the slower-than-expected CO2 rollout, managing operating expenses (OpEx) in the Emerging Technologies segment is a clear directive to protect profitability. The company has taken decisive action on cost control. Total OpEx was down $5 million so far in 2025. Furthermore, the OpEx guidance was cut by another $2 million for the year versus the second quarter of 2025. This reduction in OpEx, mainly in R&D for emerging businesses like CO2, represents a cut of more than 1/3 in that specific area, showing a commitment to prudent capital allocation as the CO2 business develops.
For context on the cost structure, first quarter 2025 Operating Expenses were reported at $17.0 million, while third quarter 2025 revenue reached $32.0 million. Cash and investments stood at $106.7 million at the end of the first quarter of 2025.
Exploring New Industrial Fluid-Flow Applications
Diversification means looking beyond CO2 refrigeration for new industrial fluid-flow applications that can use the core PX technology. The company is actively exploring these adjacent markets. One concrete example of this diversification effort is a recently won lithium attraction project in Argentina, which is an application of the PX technology within the wastewater treatment sphere. That specific project is valued at $350,000 and is expected to be recognized this quarter (Q4 2025).
The core PX technology has a proven track record in desalination, where it can reduce energy use by up to 60% compared to a system without an energy recovery device.
Targeting the CO2 Market with a 2026 Traction Plan
While the search did not yield the specific estimated $1 billion annual potential Total Addressable Market (TAM) for CO2 refrigeration by 2030, the strategic focus is clear: Energy Recovery, Inc. is targeting significant traction in this market starting in 2026. The immediate action is the plan to have another testing season, this time directly with supermarkets, in the summer of 2026. This structured approach is designed to convert strong OEM interest into measurable commercial success.
The near-term focus areas for the CO2 segment include:
- Finalizing integration feedback with key OEM partners.
- Demonstrating capacity gains in high-temperature geographies.
- Achieving measurable commercial sales traction in 2026.
- Maintaining a disciplined OpEx structure, with total OpEx down $5 million year-to-date in 2025.
Finance: draft 13-week cash view by Friday.
Disclaimer
All information, articles, and product details provided on this website are for general informational and educational purposes only. We do not claim any ownership over, nor do we intend to infringe upon, any trademarks, copyrights, logos, brand names, or other intellectual property mentioned or depicted on this site. Such intellectual property remains the property of its respective owners, and any references here are made solely for identification or informational purposes, without implying any affiliation, endorsement, or partnership.
We make no representations or warranties, express or implied, regarding the accuracy, completeness, or suitability of any content or products presented. Nothing on this website should be construed as legal, tax, investment, financial, medical, or other professional advice. In addition, no part of this site—including articles or product references—constitutes a solicitation, recommendation, endorsement, advertisement, or offer to buy or sell any securities, franchises, or other financial instruments, particularly in jurisdictions where such activity would be unlawful.
All content is of a general nature and may not address the specific circumstances of any individual or entity. It is not a substitute for professional advice or services. Any actions you take based on the information provided here are strictly at your own risk. You accept full responsibility for any decisions or outcomes arising from your use of this website and agree to release us from any liability in connection with your use of, or reliance upon, the content or products found herein.