
|
Graco Inc. (GGG): ANSOFF MATRIX [Dec-2025 Updated] |
Fully Editable: Tailor To Your Needs In Excel Or Sheets
Professional Design: Trusted, Industry-Standard Templates
Investor-Approved Valuation Models
MAC/PC Compatible, Fully Unlocked
No Expertise Is Needed; Easy To Follow
Graco Inc. (GGG) Bundle
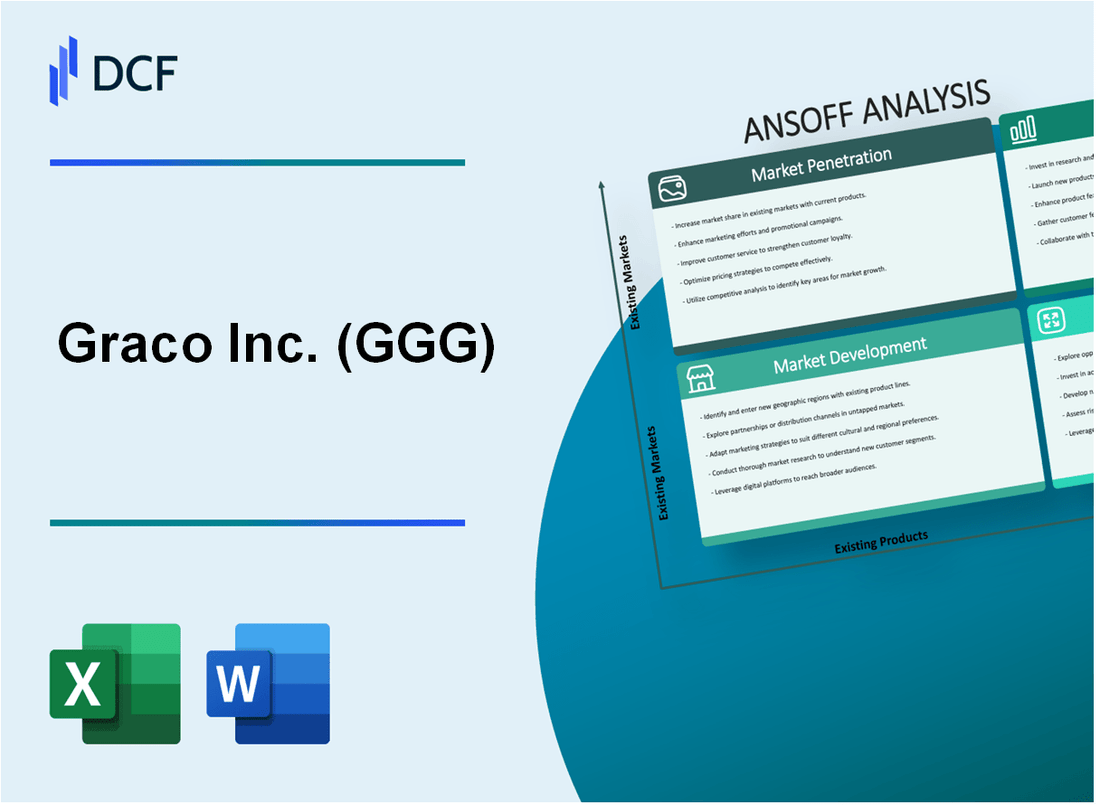
You're looking for clear, actionable growth strategies for Graco Inc., and honestly, after spending years mapping capital deployment at firms like BlackRock, this Ansoff Matrix is the clearest near-term roadmap we have. It distills complex decisions into four distinct paths: digging deeper into existing markets, taking proven gear to new geographies or industries, launching next-gen products, or making bold diversification plays like entering industrial filtration. This isn't theory; it's a set of concrete actions designed to move the needle on revenue, so you need to see the specifics below to understand where the management team is placing its bets for the coming fiscal year.
Graco Inc. (GGG) - Ansoff Matrix: Market Penetration
Market Penetration focuses Graco Inc. on selling more of its existing products into its current markets, which for the Contractor segment means deepening relationships with painting contractors and increasing the installed base of sprayers.
The baseline for this strategy is the existing market position. For the fiscal year ended December 27, 2024, the Contractor segment represented approximately 47% of Graco Inc. total sales, amounting to a portion of the total net sales of $2,113.3 million. More recently, in the second quarter of 2025, the Contractor segment posted revenue of $289 million, representing 49% of that quarter's total net sales of $571.8 million. The objective here is to move this share to a target of 50% of the total market, which implies capturing a larger share of the existing contractor spending pool.
To drive this market share gain, the immediate tactical steps involve direct customer incentives and marketing focus:
- Increase Contractor segment market share from the 2024 baseline of approximately 47% to a goal of 50%.
- Expand digital marketing spend by a planned 15%, specifically targeting the small-to-mid-sized painting contractors who are often the primary users of the core sprayer equipment.
The following table summarizes the financial context for the Contractor segment based on recent reporting periods:
| Metric | Fiscal Year 2024 (Full Year) | Q2 2025 |
| Segment Revenue Contribution | Approximately 47% of total sales | 49% of total sales |
| Segment Revenue Amount | Calculated from $2,113.3 million total sales | $289 million |
| Operating Margin Rate | Decreased from 30% to 28% (2023 to 2024) | 26% (Q2 2025) |
Addressing the equipment lifecycle is a key lever for penetration. While Graco Inc.'s current stated policy indicates they do not offer a formal trade-in program or credit for older products, the proposal is to launch aggressive trade-in programs for older Graco Inc. sprayers. This action is designed to stimulate immediate replacement purchases among the existing customer base, effectively pulling future sales forward. For example, a targeted promotion could offer a fixed dollar amount off a new high-end sprayer when an older model is surrendered, aiming to directly counter competitor upgrade offers.
Deepening channel relationships is critical for execution. This involves structuring volume-based incentives that reward distributors for moving Graco Inc. product lines aggressively over competitors. For instance, a tiered incentive structure could be implemented where distributors achieving greater than 105% of their prior year's Contractor segment volume receive an additional 2% margin rebate on all incremental sales above that threshold.
Finally, boosting recurring revenue through service is a necessary complement to unit sales. The strategy requires promoting maintenance contracts to existing customers. While specific recurring revenue figures from service contracts are not publicly detailed, the focus is on increasing the attach rate of these service agreements to new and existing equipment sales. A successful penetration effort here would see the attach rate for a standard preventative maintenance package increase from a current estimated level of 15% to over 25% within the fiscal year.
Finance: draft 13-week cash view by Friday.
Graco Inc. (GGG) - Ansoff Matrix: Market Development
You're looking at expanding Graco Inc. (GGG)'s footprint by taking existing products into new geographic areas or new applications within existing geographies. This is where we map out the potential scale using the numbers we have from the latest filings.
Target emerging industrial markets like Vietnam and Indonesia for Process segment pumps.
Graco Inc. (GGG) reported total net sales of $2,113 million for the fiscal year ended December 27, 2024. The Process segment, which handles fluids like chemicals and wastewater, represented a portion of that revenue base. In 2024, the Contractor segment accounted for approximately 47% of total sales, and the Industrial segment was 29% of sales. This implies the Process segment contributed approximately 24% of the $2,113 million in 2024 net sales, equating to roughly $507.12 million. The company already lists Vietnam and Indonesia among its served countries. The US Water and Wastewater Treatment Market size was $64.27 billion in 2024.
Adapt existing high-pressure sprayers for new applications in the marine coating industry.
Graco Inc. (GGG) offers sprayers under the Contractor segment, which focuses on applying paint to walls and coatings to roofs. The company invested $87 million in new product development in 2024, which represented approximately 4 percent of sales. The acquisition of Corob, a leader in dispensing and mixing for paints and coatings, was expected to close in the fourth quarter of 2024.
Establish a dedicated sales force to penetrate the municipal water treatment sector in the US.
The US Water and Wastewater Treatment Market is substantial, calculated at $64.27 billion in 2024. Municipal applications held a dominant market position, capturing more than 58.3% share in 2024. The average annual operating cost for a typical municipal wastewater treatment plant in the US is between $500,000 and $2 million.
Acquire a regional distributor in Eastern Europe to accelerate geographic reach.
In 2024, the EMEA region (Europe, Middle East and Africa) contributed 21% of Graco Inc. (GGG)'s total sales. The EMEA region experienced decreased industrial activity, particularly in Western Europe. Graco Inc. (GGG) reported total sales of $2,113.3 million in 2024.
Certify existing products for new regulatory standards in the European Union (EU).
Graco Inc. (GGG) lists the European Union as a served region. The company noted risks associated with complying with foreign legal and regulatory requirements and changes in trade policy or tariff rates. Incremental expenses from acquired operations of $10 million (or 7 percent) were noted in Q1 2025 operating expenses.
Here's a look at the segment and geographic revenue context for 2024:
| Metric | Value (2024) | Source Context |
| Total Net Sales | $2,113 million | Annual Net Sales |
| Contractor Segment Sales Share | 47% | Share of total sales |
| Industrial Segment Sales Share | 29% | Share of total sales |
| Process Segment Sales Share (Implied) | 24% | Calculated as 100% - 47% - 29% |
| EMEA Sales Share | 21% | Share of total sales |
| New Product Development Spend | $87 million | Total product development expenditures |
The focus on Market Development means leveraging existing product strengths in areas where the market size justifies the investment. For instance, targeting the US municipal water sector means aiming for a slice of a market projected to reach $123.76 billion by 2034.
The strategic moves under this quadrant require careful resource allocation. Consider the following key areas for investment tracking:
- Investment in dedicated US municipal sales force headcount.
- Cost associated with achieving new EU product certifications.
- Revenue contribution from Vietnam and Indonesia Process pump sales in 2026.
- Incremental revenue from marine coating sprayer applications.
- Total cash outlay for the Eastern Europe distributor acquisition.
The Process segment sales declined 12% year-over-year in Q3 2024, suggesting this area needs focused market development to reverse the trend.
Finance: draft 13-week cash view by Friday.
Graco Inc. (GGG) - Ansoff Matrix: Product Development
You're looking at how Graco Inc. plans to grow by launching entirely new products into its existing markets. This is the Product Development quadrant of the Ansoff Matrix, and it's where innovation meets established customer bases. For context, Graco Inc. reported trailing 12-month revenue of $2.19B as of September 30, 2025, with the Industrial segment accounting for 43% of Q2 2025 sales at $242 million.
The focus here is engineering specialized equipment for specific, high-value applications within those established segments.
Introduce a new line of battery-powered, low-pressure pumps for the food and beverage industry.
Graco Inc. has a history of supporting the movement of materials that fuel us for the day ahead. This new product line targets a sector where Graco already has a presence, but with a specific technology upgrade-battery power and low pressure-which is critical for sanitary and portable applications. The Industrial segment, which saw $242 million in revenue in Q2 2025, is a likely home for this new product family.
Develop smart, IoT-enabled spray equipment for real-time performance monitoring and maintenance.
This initiative leans into digital integration, which is a major trend. While specific IoT revenue isn't public, the company's focus on global strategic alignment is meant to accelerate innovation. This type of equipment would likely enhance the performance of existing spray systems, potentially boosting the operating margin in the Industrial segment, which stood at a strong 34% in Q2 2025.
- Real-time data capture for predictive maintenance.
- Integration with existing fleet management software.
- Remote diagnostics reducing service call frequency.
- Improved application consistency for high-value coatings.
Launch a modular, easily-upgradable fluid dispensing system for the automotive manufacturing sector.
The automotive sector is a key end-market for Graco Inc.. The move towards modularity addresses the need for flexibility in fast-changing assembly lines. This directly supports the Industrial segment's focus on manufacturing customers. Capital expenditures for the full year 2025 were projected to be between $60-70 million, indicating investment in future capacity and technology like this.
Create specialized, high-viscosity pumps for the growing adhesives and sealants market.
This targets a market with significant projected growth. The global adhesives and sealants market is estimated at $85.38 billion in 2025 and is expected to grow at a compound annual growth rate (CAGR) of around 6.0% through 2032. Within this, reactive systems are forecasted to post the fastest CAGR to 2030 at 8.20%. Graco's existing equipment for sealants and adhesives is part of its core offering.
Here's a look at the scale of the relevant market opportunity for high-viscosity dispensing:
| Market Metric | Value/Rate | Year/Period |
| Adhesives and Sealants Market Size | $85.38 billion | 2025 Estimate |
| Adhesives Market Share (by Revenue) | $4.51 billion | 2024 |
| Silicone Resins CAGR | 8.50% | 2025-2030 Forecast |
| Reactive Systems CAGR | 8.20% | To 2030 Forecast |
Engineer more sustainable, solvent-free application equipment for industrial coatings.
This aligns with global regulatory pressure for lower-emission chemistries. The focus on cleaner technologies is a strategic imperative, especially given Graco's commitment to ESG progress. This development would likely be housed within the Industrial segment, which maintained a strong operating margin of 34% in Q2 2025. The company's overall organic sales growth guidance for the full year 2025 is for low single-digit sales growth on a constant-currency basis, so new product introductions like this are key to meeting that target.
The company completed the acquisition of Corob for a final purchase price payment during Q2 2025, which contributed 6 percentage points to the overall sales growth in that quarter. Also, the acquisition of Radia Products was valued at $69 million in November 2025.
Finance: draft 13-week cash view by Friday.
Graco Inc. (GGG) - Ansoff Matrix: Diversification
You're looking at how Graco Inc. is pushing beyond its core fluid handling for existing customers, which is the essence of diversification in the Ansoff Matrix. This isn't just about selling more paint sprayers; it's about using that core pump technology in new areas. For context, Graco Inc. reported net sales of $543.4 million for the three months ended September 26, 2025, with trailing twelve-month revenue reaching $2.192B as of September 30, 2025.
The company formalized a strategy for this with a new organizational structure effective January 1, 2025, creating the Expansion Markets segment. This segment is specifically tasked with driving inorganic growth in new or adjacent markets. It houses existing environmental, semiconductor, high-pressure valves, and electric motors businesses, alongside select future ventures and acquisitions in these new spaces.
The most concrete evidence of this diversification push comes through strategic acquisitions, which often serve as a proxy for entering new product/market combinations or developing new products for adjacent markets. Here's a look at the recent capital deployed for these moves:
| Acquisition Target | Primary Focus Area | Acquisition Cost (Approximate) | 2023/2024 Revenue Reference |
|---|---|---|---|
| Corob S.p.A. | High-tech Dispense/Mix (Contractor Segment Adjacent) | €230 million (+ up to €30 million contingent) | €110 million (2023 Revenue) |
| Color Service S.r.l. | Automated Dosing Systems (Powder/Liquid) | €63 million | €34 million (2024 Revenue) |
| Red Devil Equipment Company (Radia) | Paint Mixing Equipment | $69 million | Not explicitly stated |
The impact of these moves is already showing up in the top line. For instance, the Corob acquisition contributed 6 percentage points to the 3% year-over-year sales increase reported in the second quarter of 2025, and 6% growth in the first quarter of 2025.
Regarding the specific diversification vectors you mentioned, Graco Inc.'s actions map to the following strategic intents, supported by the segment structure and M&A activity:
- Acquire a small robotics company specializing in automated surface preparation and finishing: This intent aligns with the mandate of the Expansion Markets segment to pursue acquisitions in new or adjacent markets.
- Enter the industrial filtration market with new products leveraging Graco Inc.'s pump technology: The existing environmental business, which is part of the Expansion Markets segment, suggests a foundation for this type of adjacent market entry using core fluid management expertise.
- Develop a subscription-based software platform for job-site management and equipment utilization: While specific software revenue is not public, job-site management is a clear adjacent service opportunity for the Contractor segment, which makes up the largest portion of the business.
- Form a joint venture to create specialized medical fluid delivery systems, a new market: The focus on 'new or adjacent markets' within the Expansion Markets Division provides the structural vehicle for such a high-potential, new-market venture.
- Invest in additive manufacturing (3D printing) equipment for industrial tooling and parts: The company reported investments in new product development in 2024, and the Expansion Markets segment is designed to absorb these types of technology-focused ventures. Capital expenditures for the first half of 2025 totaled $30 million.
The overall financial health supports this aggressive posture; Graco's cash and cash equivalents increased by $143 million to $1.1 billion at the end of 2024, though operating cash flow was $622 million in 2024, down from $651 million in 2023. The company is actively deploying capital for growth, using $242 million for business acquisitions in 2024.
Disclaimer
All information, articles, and product details provided on this website are for general informational and educational purposes only. We do not claim any ownership over, nor do we intend to infringe upon, any trademarks, copyrights, logos, brand names, or other intellectual property mentioned or depicted on this site. Such intellectual property remains the property of its respective owners, and any references here are made solely for identification or informational purposes, without implying any affiliation, endorsement, or partnership.
We make no representations or warranties, express or implied, regarding the accuracy, completeness, or suitability of any content or products presented. Nothing on this website should be construed as legal, tax, investment, financial, medical, or other professional advice. In addition, no part of this site—including articles or product references—constitutes a solicitation, recommendation, endorsement, advertisement, or offer to buy or sell any securities, franchises, or other financial instruments, particularly in jurisdictions where such activity would be unlawful.
All content is of a general nature and may not address the specific circumstances of any individual or entity. It is not a substitute for professional advice or services. Any actions you take based on the information provided here are strictly at your own risk. You accept full responsibility for any decisions or outcomes arising from your use of this website and agree to release us from any liability in connection with your use of, or reliance upon, the content or products found herein.