
|
Graco Inc. (GGG): BCG Matrix [Dec-2025 Updated] |
Fully Editable: Tailor To Your Needs In Excel Or Sheets
Professional Design: Trusted, Industry-Standard Templates
Investor-Approved Valuation Models
MAC/PC Compatible, Fully Unlocked
No Expertise Is Needed; Easy To Follow
Graco Inc. (GGG) Bundle
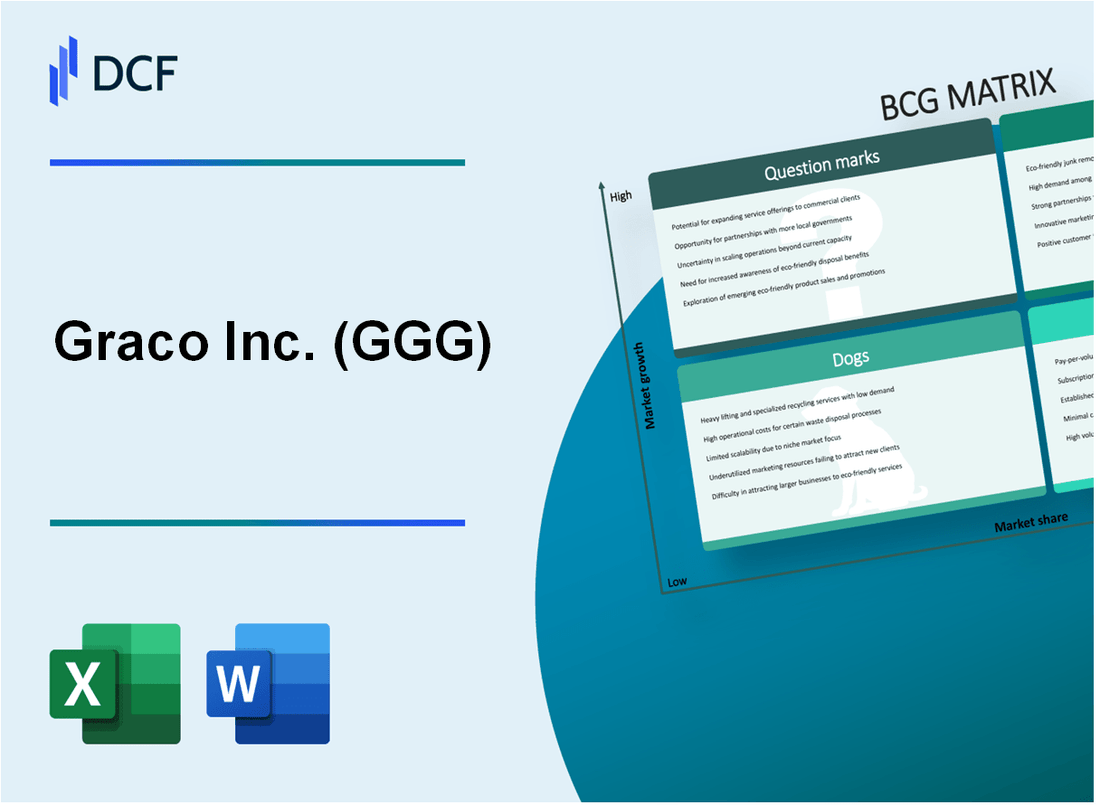
You're looking for a clear-eyed view of Graco Inc.'s business portfolio as of late 2025, and the BCG Matrix shows exactly where the cash is flowing and where the big bets are being placed. Honestly, the Contractor Segment remains the bedrock, banking a massive $\text{47% of sales with a $\text{53.1% gross margin, while the Industrial Segment's finishing systems are true Stars, boasting a $\text{34% operating margin. Still, we can't ignore the Dogs, like the legacy lines dragging down time, or the Question Marks-like the small $\text{8% Expansion Markets Segment-that need heavy capital to chase that double-digit growth from semiconductor tech. Let's break down this map to see where Graco Inc. needs to invest, hold, or divest right now.
Background of Graco Inc. (GGG)
You're looking at Graco Inc. (GGG), a major player in fluid handling systems and equipment, which serves industrial and commercial customers globally. The company manufactures devices used to move, measure, control, dispense, and spray fluid and coating materials. As of late 2025, Graco Inc. has reorganized its business structure into three primary segments for better focus: Contractor, Industrial, and Expansion Markets, effective January 1, 2025.
Looking at the top line, Graco Inc.'s revenue for the trailing twelve months ending September 26, 2025, stood at approximately $2.19 Billion USD. This compares to the full fiscal year 2024 revenue of $2.11 Billion USD. For the third quarter of 2025, net sales were reported at $543.4 million, which represented a 5 percent increase year-over-year, though organic revenue actually declined 2 percent due to softness in global construction markets.
The segment performance shows a mixed picture as the company integrates recent acquisitions. For instance, in the first quarter of 2025, the Contractor segment, which represented 48 percent of sales in that period, saw net sales surge 11 percent to $255 million, though operating earnings fell 6 percent because of lower-margin acquisitions. The Industrial segment, making up 33 percent of Q1 sales, grew 3 percent to $176 million, while the Expansion Markets segment, at 16 percent of Q1 sales, grew 12 percent to $84 million.
Financially, as of the third quarter of 2025, Graco Inc. maintained a net margin of 22.72 percent and a return on equity (ROE) of 18.89 percent. The company's market capitalization hovered around $13.66 billion in November 2025, trading at a Price-to-Earnings ratio in the range of 27.62 to 28.11. Graco also continues to support its shareholder base with a regular quarterly dividend of $0.275 per common share.
Graco Inc. (GGG) - BCG Matrix: Stars
The Star quadrant for Graco Inc. (GGG) is anchored by business units that command a high relative market share within markets that are still experiencing significant growth, even if the broader industrial sector is slowing. These units require substantial cash infusion to maintain their technological edge and market leadership.
The Industrial Segment's core finishing systems represent a key Star. This area delivered a strong operating margin rate of 34% in the second quarter of 2025. This profitability, despite market dynamics, underscores its leadership position. The segment's Q2 2025 sales were reported at $242 million, flat year-over-year, but this stability is noteworthy given sector headwinds.
Protective coatings equipment is another area fitting the Star profile. This business saw its best performance of the year in the third quarter of 2025, directly supported by increased demand stemming from infrastructure investments. This performance suggests a high-growth niche within the broader industrial landscape.
The company maintains a high relative market share in the industrial fluid handling space. While the Industrial segment experienced a 2% organic revenue decline in Q3 2025, its overall performance, including acquisition contributions, has been resilient, outperforming peers in a generally slowing industrial sector. This segment's ability to maintain a strong margin, like the 34% in Q2 2025, while navigating sector slowdowns, confirms its leadership status.
To keep these market leaders ahead, continued investment in premium technology is essential. The requirement for ongoing support is reflected in historical investment levels, such as the need for continued investment in R&D, which saw an increase of 7% year-over-year in 2023. More recently, Graco invested $87 million in new product development and other growth initiatives in 2024, representing approximately 4% of that year's sales.
Here is a summary of the key financial and performance indicators associated with these Star-like businesses as of the latest reported periods:
| Metric | Segment/Area | Value | Period/Context |
| Operating Margin | Industrial Segment Core Finishing Systems | 34% | Q2 2025 |
| Revenue | Industrial Segment | $242 million | Q2 2025 (Year-over-Year) |
| Organic Revenue Change | Industrial Segment | -2% | Q3 2025 |
| R&D Investment | Company-wide Product Development | $87 million | 2024 |
| R&D as % of Sales | Company-wide Product Development | 4% | 2024 |
The continued success of these units hinges on maintaining this technological lead, which necessitates significant ongoing cash deployment. These Stars are the primary candidates for future Cash Cows, provided they sustain their market position as the high-growth markets they serve mature.
Key characteristics driving the Star designation for these units include:
- High relative market share in fluid handling.
- Strong operating margin performance, such as 34% in Q2 2025.
- Best performance of the year noted for Protective coatings equipment in Q3 2025.
- Historical R&D support, including a 7% increase in 2023.
Finance: draft 13-week cash view by Friday.
Graco Inc. (GGG) - BCG Matrix: Cash Cows
You're looking at the core engine of Graco Inc.'s financial stability, the Cash Cows. These are the business units that dominate mature markets, throwing off more cash than they need to maintain their position. For Graco, this category is anchored by the Contractor Segment.
The Contractor Segment is the company's largest business unit, representing approximately 47% of the 2024 total sales of $2,113.3 million. This translates to segment sales of about $993.251 million for the year. This segment's dominance in a mature market, particularly with its airless paint sprayer product lines which hold a leading market share, solidifies its Cash Cow status.
The financial output from this segment is substantial, helping Graco maintain a fortress balance sheet. The company ended 2024 with approximately $675 million in cash and cash equivalents. Critically, Graco Inc. reported its long-term debt for 2024 as $0B, confirming the low-investment need for debt servicing.
The profitability metrics for Graco in 2024 underscore the high-margin nature of these established products. The company posted a high gross profit margin of 53.1% in 2024. This margin reflects strong pricing power and operational efficiency within its core product offerings, which require minimal growth-focused promotion.
Cash Cows like the Contractor Segment are where you want to be; they fund everything else. Here's the quick math: this segment's high-margin sales generate the necessary capital to cover corporate overhead, fund the development of Question Marks, and pay shareholders.
Key financial indicators supporting the Cash Cow classification for Graco's core business in 2024:
- Contractor Segment Share of Sales: 47%
- Gross Profit Margin: 53.1%
- Cash and Cash Equivalents (Year End): $675 million
- Long-Term Debt (Year End): $0B
The strategy here is maintenance and efficiency. Instead of heavy spending on market expansion, investments should target infrastructure that boosts cash flow further, like process improvements.
| Financial Metric | Value for 2024 | Context |
| Total Net Sales | $2,113.3 million | Overall company revenue base |
| Contractor Segment Sales Percentage | 47% | Market share dominance in mature area |
| Gross Profit Margin | 53.1% | Indicates strong pricing and efficiency |
| Cash and Cash Equivalents (Year End) | $675 million | Cash generated for corporate use |
| Long-Term Debt (Year End) | $0B | Minimal cash drain from debt servicing |
You should expect Graco Inc. to continue 'milking' these gains passively, focusing capital expenditures on supporting infrastructure rather than aggressive marketing for these established product lines.
Graco Inc. (GGG) - BCG Matrix: Dogs
Dogs, in the Boston Consulting Group Matrix framework, represent business units or product lines characterized by a low market share in a low-growth market. These units often break even, tying up capital without generating significant returns, making divestiture a common strategic consideration.
North American Home Center channel sales within the Contractor Segment are exhibiting classic Dog behavior, reflecting continued sluggish activity in the third quarter of 2025. Management commentary for the third quarter of 2025 cited ongoing softness in global construction markets, particularly in North America, contributing to a 2% organic revenue decline for the entire company. This channel specifically saw softness in the second quarter of 2025 due to reduced foot traffic in home centers, which is indicative of a mature, low-growth environment where market share gains are difficult to achieve.
Certain legacy product lines in mature, highly competitive industrial applications also fall into this quadrant. The Industrial segment, which represented 29% of total sales in 2024, posted only a 1% sales increase for the third quarter of 2025. This low single-digit growth rate, especially when compared to the company's overall reported net sales growth of 5% in Q3 2025 (heavily influenced by acquisitions), signals a low-growth market for these established offerings.
Here is a look at the segments/regions that exhibit characteristics aligning with the Dog quadrant based on recent performance metrics:
| Area of Business | 2024 Revenue Share (Low Market Share Proxy) | Q3 2025 Sales Change (Low Growth Proxy) | 2024 Annual Net Sales (Millions USD) |
| Contractor Segment (Overall) | 47% | Organic Revenue declined 2% | Approximately $993.2 million (47% of $2,113.3M) |
| Industrial Segment (Overall) | 29% | Increased 1% | Approximately $612.8 million (29% of $2,113.3M) |
| Asia Pacific Region (2024 Context) | 16% of Total Sales (Geographic) | Experienced a 16% decline in Q2 2024 | Not directly segmentable, but represented 16% of 2024 sales |
The Asia Pacific region sales performance serves as a stark example of the volatility and low-return nature that can characterize a Dog area before a potential shift. This region saw a significant decline of 16% in the second quarter of 2024, driven by reduced project activity, which aligns with the low-growth market scenario. While Q3 2025 saw a rebound with sales increasing 7% at consistent translation rates, the prior year's severe contraction highlights the inherent risk and low market share position it held, justifying its consideration as a Dog based on historical performance and market volatility.
These areas, including the sluggish North American home center channel and mature industrial lines, absorb significant management time for maintenance and minor adjustments but offer minimal prospects for substantial organic growth or market share gains in the near term. The capital tied up in inventory, working capital, and management focus within these units could be redeployed to higher-potential Stars or Question Marks.
Graco Inc. (GGG) - BCG Matrix: Question Marks
You're looking at the Graco Inc. business units that are currently burning cash to fuel expansion, the classic Question Marks. These are areas with high market potential but where Graco Inc. hasn't yet secured a dominant position. Honestly, this is where the biggest future Stars will either emerge or where capital gets tied up unnecessarily.
The primary area fitting this profile is the Expansion Markets segment, which Graco Inc. redefined effective January 1, 2025, to focus on inorganic growth in new or adjacent markets, including environmental and semiconductor applications. This segment is small relative to the whole, but it's growing fast, which is the hallmark of a Question Mark.
Here are the key financial and statistical markers for this group as of the first half of 2025:
- Expansion Markets segment sales were 8% of total Q2 2025 sales.
- In Q1 2025, Expansion Markets segment net sales reached $41.6 million, an 18% increase year-over-year.
- The organic core sales growth within that segment in Q1 2025 was 12%.
- For the full second quarter ended June 27, 2025, Expansion Markets revenue was $41 million, representing a 3% decline versus Q2 2024.
- Despite the Q2 revenue dip, operating earnings for Expansion Markets increased 5% to $9 million, pushing the operating margin up from 20% to 22%.
The growth story here is clearly acquisition-dependent right now, which is a common strategy to quickly build share in a high-growth area. For instance, total acquired operations contributed 6% to Graco Inc.'s overall Q2 2025 sales growth, which helped offset a 3% organic revenue decline in that same quarter. You see this inorganic push with the recent bolt-on acquisitions.
Here's a quick look at the recent M&A activity impacting this growth profile:
| Acquisition Target | Expected Segment Placement | Reported Financial Detail |
| Corob S.p.A. | Contractor Division (as of Q1 2025) | Contributed 6% of Q2 2025 sales growth. |
| Color Service S.r.l. | Industrial Segment (Gema Powder Division) | Acquisition price was €63 million; 2024 revenue was €34 million. |
The semiconductor and environmental technology applications are specifically housed within the Expansion Markets Division. While the semiconductor end markets showed improvement in Q1 2025, leading to strong organic growth in the segment, the environmental business experienced a decline in Q2 2025, which offset the continued positive momentum in semiconductor sales for that quarter. This volatility underscores the risk inherent in these Question Marks; they need focused investment to quickly capture market share before the high-growth markets mature and they risk becoming Dogs.
The core challenge for Graco Inc. here is the capital allocation decision. You need to decide if the potential payoff from these emerging areas-like the semiconductor sector where they saw growth-justifies the cash drain required to build out that market share against established competitors. If onboarding takes 14+ days, churn risk rises, but here, if investment lags, market share is lost.
Disclaimer
All information, articles, and product details provided on this website are for general informational and educational purposes only. We do not claim any ownership over, nor do we intend to infringe upon, any trademarks, copyrights, logos, brand names, or other intellectual property mentioned or depicted on this site. Such intellectual property remains the property of its respective owners, and any references here are made solely for identification or informational purposes, without implying any affiliation, endorsement, or partnership.
We make no representations or warranties, express or implied, regarding the accuracy, completeness, or suitability of any content or products presented. Nothing on this website should be construed as legal, tax, investment, financial, medical, or other professional advice. In addition, no part of this site—including articles or product references—constitutes a solicitation, recommendation, endorsement, advertisement, or offer to buy or sell any securities, franchises, or other financial instruments, particularly in jurisdictions where such activity would be unlawful.
All content is of a general nature and may not address the specific circumstances of any individual or entity. It is not a substitute for professional advice or services. Any actions you take based on the information provided here are strictly at your own risk. You accept full responsibility for any decisions or outcomes arising from your use of this website and agree to release us from any liability in connection with your use of, or reliance upon, the content or products found herein.