
|
Graco Inc. (GGG): 5 FORCES Analysis [Nov-2025 Updated] |
Fully Editable: Tailor To Your Needs In Excel Or Sheets
Professional Design: Trusted, Industry-Standard Templates
Investor-Approved Valuation Models
MAC/PC Compatible, Fully Unlocked
No Expertise Is Needed; Easy To Follow
Graco Inc. (GGG) Bundle
You're looking to map out the competitive landscape for Graco Inc. right now, and honestly, the picture is a mix of solid defense and sharp pressure points heading into late 2025. Despite posting a trailing twelve-month revenue of $2.19 billion as of Q3 2025, the recent earnings showed that acquisition growth is currently covering a 2% organic sales decline, which tells you the five forces are definitely at work. We see Graco's deep technical expertise and brand loyalty building a wide economic moat, yet they face high rivalry from giants like Illinois Tool Works and a more demanding Contractor segment where customer power ticks up. Before you decide on your next move, you need to see exactly how their leverage over suppliers, the threat of substitutes like simple rollers, and the high bar for new entrants are shaping the long-term profitability of this industrial player.
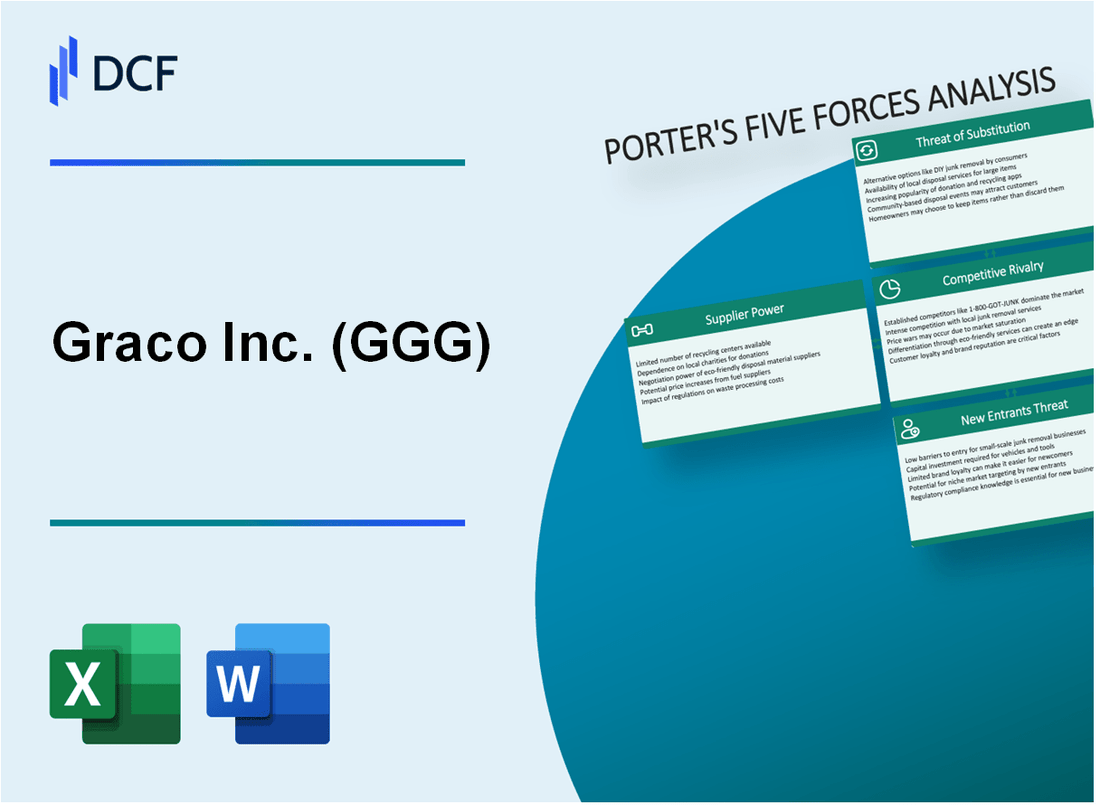
Graco Inc. (GGG) - Porter's Five Forces: Bargaining power of suppliers
When you look at the power suppliers hold over Graco Inc., you're essentially looking at how much Graco can dictate terms versus how much its component providers can push back on price or terms. For a company that manufactures complex fluid handling equipment, the supply chain is defintely critical.
Graco demands an ANNUAL COST REDUCTION from its supply partners. This is a standard practice in large-scale manufacturing to maintain competitive pricing and offset inflation, even if the specific target percentage isn't public record. What is public is the result of these negotiations and pricing strategies: Graco's gross profit margin was a healthy 53.1% in 2024, an increase from 52.9% in 2023, achieved by using pricing actions to counter rising product costs.
Suppliers cannot change material, design, or process without Graco's approval. This speaks directly to Graco's engineering control and intellectual property protection over its final product specifications, which limits a supplier's ability to unilaterally alter the cost structure or quality of a critical input.
Input costs for metals and engineered components are a risk, but Graco's 53.1% gross margin in 2024 offers a buffer. However, the pressure is real. For instance, in the third quarter of 2025, higher product costs included increased tariff costs of $5 million for the quarter and $9 million for the year to date. This cost pressure is reflected in the year-to-date gross profit margin rate decreasing approximately 1 percentage point from the comparable periods last year as of Q3 2025. Management has also noted potential negative impacts from trade policies and tariffs with China, which could affect sales by 1-2%.
The company's large purchasing volume in core materials gives it leverage. While specific volume figures aren't broken out by material category, the scale of Graco's operations-serving thousands of customers in over 100 countries-suggests significant buying power for commodity inputs. The company's focus on operational efficiencies, such as the One Graco initiative, is partly aimed at improving overall cost management, which aids in supplier negotiations.
Specialized component suppliers for high-precision pumps have slightly higher power. Graco relies on a network of specialized distributors and components for its premium equipment, particularly for proprietary technologies like its pumps. When a component requires unique engineering or high-precision manufacturing, the pool of qualified suppliers shrinks, naturally increasing their leverage relative to suppliers of more commoditized parts.
Here's a quick look at the financial context surrounding these pressures:
| Metric | Value/Period | Source Year/Period |
|---|---|---|
| Gross Profit Margin | 53.1% | 2024 |
| Gross Profit Margin Change (YTD) | Down approx. 1 percentage point | YTD 2025 (vs. prior year) |
| Tariff-Related Cost Increase (Q3) | $5 million | Q3 2025 |
| Tariff-Related Cost Increase (YTD) | $9 million | YTD 2025 (as of Q3) |
| Product Development Spend | $87 million | 2024 |
The bargaining power dynamic is a constant push-and-pull. Graco uses its scale and engineering control to push down costs, but rising external factors like tariffs and the need for highly specialized parts mean that certain suppliers can still command better terms.
You can see the effect of this dynamic in the operational levers Graco pulls:
- Pricing actions used to offset higher product costs.
- Operating expense leverage offsetting lower gross margins.
- Focus on operational efficiencies like inventory management.
- Investment in new products to maintain differentiation.
Finance: draft 13-week cash view by Friday.
Graco Inc. (GGG) - Porter's Five Forces: Bargaining power of customers
You're looking at Graco Inc.'s customer power, and honestly, it's not a single story; it really depends on which part of their business you're focused on. The power customers hold shifts dramatically between the highly specialized industrial side and the more commoditized contractor side.
Power is definitely low when you look at the high-end, customized industrial systems, which heavily involve the Process segment. Here, Graco Inc. engineers solutions for moving difficult, corrosive, or viscous materials-think pumps for peanut butter or specialized oil and gas injection systems. These are niche applications where the equipment is deeply integrated into a customer's production line. If you're an industrial buyer, switching away from Graco Inc. means re-engineering a whole process, which creates high barriers to exit.
Switching costs are high for these industrial customers precisely because of that system integration and the specialized training required to run the equipment. Furthermore, the fact that roughly ~40% of Graco Inc.'s revenue comes from parts and accessories suggests a strong installed base, locking customers into the Graco Inc. ecosystem for maintenance and consumables. That recurring revenue stream is a powerful insulator against customer demands for lower pricing.
The dynamic changes in the Contractor segment. This area, which represented about 47% of Graco Inc.'s 2024 sales, faces higher customer power because there are more readily available options for standard paint sprayers and related tools. For a contractor buying off-the-shelf equipment, finding a competitor's comparable product is easier than for a process engineer designing a new chemical plant.
To give you a sense of the current weighting, the Q3 2025 Year-to-Date distribution of global sales shows the Contractor segment at 43% of sales, while Industrial was at 22% and Expansion Markets at 16%. This confirms the Contractor segment remains the largest revenue driver, making its competitive dynamics very important.
Graco Inc. also dilutes the direct end-user power by relying heavily on its global network of third-party distributors. These distributors act as a buffer; they manage the direct relationship with many smaller end-users, absorbing some of the day-to-day negotiation pressure that might otherwise fall directly on Graco Inc. The company lists dependence on a few large customers as a risk factor, but the reality is that no single customer is definitively dominant. For instance, Home Depot, a major retail channel partner, accounts for only about 8% of Graco Inc.'s total revenue, based on internal assessments.
Here's a quick comparison of the customer power dynamics across the main segments:
| Segment Characteristic | Process/Industrial (High Customization) | Contractor (Standard Equipment) |
|---|---|---|
| Customer Power Level | Low | Higher |
| Primary Barrier to Switching | High system integration and training costs | More available product options |
| Revenue Weight (2024 Est.) | Lower (Industrial was 22% YTD Q3 2025) | Significant (47% of 2024 sales) |
| Stickiness Evidence | Parts/Accessories account for ~40% of revenue | More direct competition |
The overall leverage customers have is tempered by a few key factors:
- Power is low in Process segment due to specialized, integrated systems.
- Contractor segment power is higher due to more product availability.
- Distributor network dilutes direct end-user leverage over Graco Inc.
- No single customer dominates; Home Depot is only around 8% of revenue.
- Industrial switching costs are high due to system integration needs.
- Parts and accessories represent about 40% of total revenue, indicating customer lock-in.
Graco Inc. (GGG) - Porter's Five Forces: Competitive rivalry
You're looking at the competitive intensity in the fluid handling space, and honestly, it's a tough neighborhood. Rivalry is high, driven by major, diversified industrial players like Illinois Tool Works (ITW) and Nordson Corporation (NDSN). These aren't small-time players; they bring massive scale and deep pockets to the fight.
To give you a sense of the scale, look at the Q3 2025 top-line numbers for these competitors. ITW, which holds an estimated 20% market share in the broader industrial space, reported Q3 2025 revenue of $4.1 billion. Nordson Corporation, another significant rival, posted Q3 2025 sales of $742 million, with a trailing twelve-month (TTM) revenue of $2.784B as of July 31, 2025. This puts pressure on Graco Inc., which reported TTM revenue of $2.19 billion as of Q3 2025.
The market structure itself contributes to this pressure. The overall market is fragmented, meaning you have a wide array of competitors, including lower-cost manufacturers who directly impact pricing power, especially in less specialized product lines. Graco Inc. is fighting to maintain its premium positioning.
Competition isn't just about price, though; it's a battle fought on product quality and service depth. Graco's own investor presentation highlights its focus on 'Strong product differentiation' and delivering the 'Lowest total cost of ownership'. This means the fight centers on tangible product attributes and support infrastructure.
Here's a quick look at the financial context of the rivalry using the latest available figures:
| Metric | Graco Inc. (GGG) (Q3 2025) | Illinois Tool Works (ITW) (Q3 2025) | Nordson Corp. (NDSN) (Q3 2025) |
|---|---|---|---|
| Quarterly Net Sales/Revenue | $543.4 million | $4.1 billion | $742 million |
| TTM Revenue (Approx.) | $2.19 billion (as of Sep 26, 2025) | Guidance Range: $16.0-$16.4 billion (FY 2025) | $2.784B (as of Jul 31, 2025) |
| Reported Operating Margin | 30.3% (Q3 2025) | 27.4% (Q3 2025) | 32% (Q3 2025 EBITDA Margin) |
The basis of this intense competition for Graco Inc. revolves around several key differentiators you need to watch:
- Product performance and durability ratings.
- The breadth and responsiveness of the global service network.
- Ability to offset tariff costs via strategic pricing actions.
- Gross profit margin maintenance, which was 53.2% year-over-year for Graco in Q3 2025.
- Effectiveness of new product investment versus peers (Graco's 5-year average R&D as a percent of sales was >1.5x its peer group).
To be defintely clear, Graco's ability to command a premium relies on proving that its product lifecycle value outweighs the initial cost, especially when facing competitors like ITW, whose enterprise initiatives contributed 140 basis points to margin in Q3 2025.
Finance: draft 13-week cash view by Friday.
Graco Inc. (GGG) - Porter's Five Forces: Threat of substitutes
You're analyzing Graco Inc.'s competitive position, and the threat from substitute products-ways customers can achieve the same end result without Graco's equipment-is definitely nuanced across its business lines. It isn't a one-size-fits-all risk.
The threat is low for high-pressure, niche applications like sanitary or semiconductor fluid handling. For instance, in the Expansion Markets segment, the semiconductor product application drove double-digit sales growth in the first quarter of 2025. This suggests that for these specialized, high-precision tasks, Graco's engineered solutions are hard to replace with a generic alternative. The complexity of moving these fluids means the functional requirement outweighs the cost of a substitute.
However, in the Contractor segment, which represented 48% of Graco Inc.'s sales in Q1 2025, substitutes are more present. For simpler coating tasks, alternative application methods like rollers or brushes are viable substitutes for sprayers. Still, Graco is actively bolstering its position here; they recently acquired Radia, a manufacturer of paint mixing equipment, which had annual revenue of more than $30 million, to enhance their offerings in the color solutions space. This move shows Graco is fighting substitution by integrating more of the customer's process.
Automation trends in fluid transfer are a key driver of market growth, and this generally favors Graco's specialized equipment over manual labor. The broader fluid handling system market is projected to grow from $63,802.09 million in 2024 to $68,478.79 million in 2025. Within this trend, adoption of automation in fluid handling processes has seen a notable increase of 25%. Graco's specialized pumps and systems, which can improve performance by 15% through better fluid handling, are positioned to capture this shift away from manual work. It's a clear tailwind for their Industrial segment, which saw 5% organic growth in Q1 2025.
Graco's wide product portfolio and focus on difficult-to-move fluids create functional differentiation that acts as a barrier to substitution. They design equipment to manage fluids, coatings, and adhesives, specializing in materials that are hard to handle. This specialization means that for many industrial or process applications, a substitute simply won't work reliably or safely. The company's trailing twelve-month revenue as of September 30, 2025, stood at $2.192B, reflecting the scale of their installed base across these critical applications.
Here's a quick look at how Graco's recent financial performance frames this competitive environment:
| Metric | Value (as of late 2025) | Context |
|---|---|---|
| TTM Revenue (as of 9/30/2025) | $2.192B | Overall scale of business. |
| Q2 2025 Revenue | $572 million | Quarterly sales figure. |
| Contractor Segment % of Sales (Q1 2025) | 48% | Largest segment, most exposed to application method substitutes. |
| Automation Adoption Increase | 25% | Industry trend favoring specialized equipment. |
| Projected Fluid Handling Market Size (2025) | $68,478.79 million | Overall market growth context. |
If onboarding takes 14+ days, churn risk rises, but for Graco, if the fluid is tough to move, the risk of a customer switching to a non-specialized substitute drops significantly.
Graco Inc. (GGG) - Porter's Five Forces: Threat of new entrants
The threat of new entrants for Graco Inc. is significantly constrained by several structural barriers that protect its established market position. Honestly, for a new player to meaningfully challenge Graco, they would need to overcome not just one, but a combination of high hurdles related to capital, technology, and market presence.
The company's wide economic moat is clearly visible in its sustained high profitability. You see this when you look at the returns it generates on the money invested in the business. For the quarter ending September 2025, Graco's annualized Return on Invested Capital (ROIC %) stood at 21.33%. Looking back, the 10-year average ROIC was 25.21%, and even over the last five years, it remained high at 23.88%. This performance is well above its cost of capital, which is calculated at 9.87% as of late 2025. This gap-earning returns significantly higher than the cost of that capital-is the definition of an economic moat in action.
A major barrier is the technical complexity and capital intensity involved in high-precision fluid handling. New entrants must master the engineering required to manage materials with challenging viscosities, abrasive properties, or those needing exact ratio control for mixing and dispensing. This isn't just about making a pump; it's about engineering reliability into mission-critical systems for industries like automotive and construction.
Graco Inc. actively raises this innovation bar through consistent, heavy spending on research and development. In fiscal year 2024, Graco invested $87 million in product development. This investment level is substantial, representing approximately 4 percent of its 2024 sales of $2,113.3 million. To be fair, some analyses suggest this R&D spend is roughly 4.5% of sales, positioning Graco to spend nearly 3 times what its competitors do on innovation. This continuous pipeline of new, proprietary technology makes it difficult for a newcomer to match the current product offering.
The physical infrastructure required to support a global customer base is another massive deterrent. Establishing a comparable global distribution and service network requires immense upfront capital and time. Graco Inc. serves customers in over 100 countries across six continents. This network is anchored by key regional headquarters, including those in Maasmechelen, Belgium (EMEA), Shanghai, China (Asia Pacific), and Porto Alegre, Brazil (South & Central America), in addition to its Worldwide Headquarters in Minneapolis, MN. Furthermore, the company operates a Worldwide Distribution Center in Dayton, MN, ensuring parts availability.
Finally, brand loyalty and reputation for quality create a sticky customer base, particularly in professional and industrial segments. When equipment failure means wasted material or costly production downtime, customers stick with proven reliability. Graco's market position suggests this loyalty translates into tangible market power. The company's market share in fluid handling systems is estimated at approximately 30%.
Here's a quick look at the financial and structural evidence supporting these high barriers:
| Barrier Component | Metric | Value/Data Point |
|---|---|---|
| Economic Moat Strength (Profitability) | ROIC (Sep. 2025 Quarter) | 21.33% |
| Economic Moat Strength (Profitability) | 10-Year Average ROIC | 25.21% |
| Innovation Barrier (R&D Investment) | R&D Spend (2024) | $87 million |
| Innovation Barrier (R&D Investment) | R&D as % of 2024 Sales | Approx. 4.0% to 4.5% |
| Distribution Barrier (Scale) | Countries Served | Over 100 |
| Brand/Reputation Barrier (Market Position) | Estimated Market Share | Approx. 30% |
The sheer scale of operations and the demonstrated ability to consistently generate superior returns make the entry point for a new competitor extremely high. New entrants must immediately match this level of performance and infrastructure, which is a defintely tall order.
- Significant capital needed for high-precision manufacturing.
- Technical expertise required for complex fluid dynamics.
- Global footprint spans six continents.
- R&D spending is 3x that of some rivals.
- Strong brand reputation supports premium pricing power.
Disclaimer
All information, articles, and product details provided on this website are for general informational and educational purposes only. We do not claim any ownership over, nor do we intend to infringe upon, any trademarks, copyrights, logos, brand names, or other intellectual property mentioned or depicted on this site. Such intellectual property remains the property of its respective owners, and any references here are made solely for identification or informational purposes, without implying any affiliation, endorsement, or partnership.
We make no representations or warranties, express or implied, regarding the accuracy, completeness, or suitability of any content or products presented. Nothing on this website should be construed as legal, tax, investment, financial, medical, or other professional advice. In addition, no part of this site—including articles or product references—constitutes a solicitation, recommendation, endorsement, advertisement, or offer to buy or sell any securities, franchises, or other financial instruments, particularly in jurisdictions where such activity would be unlawful.
All content is of a general nature and may not address the specific circumstances of any individual or entity. It is not a substitute for professional advice or services. Any actions you take based on the information provided here are strictly at your own risk. You accept full responsibility for any decisions or outcomes arising from your use of this website and agree to release us from any liability in connection with your use of, or reliance upon, the content or products found herein.