
|
HNI Corporation (HNI): 5 FORCES Analysis [Nov-2025 Updated] |
Fully Editable: Tailor To Your Needs In Excel Or Sheets
Professional Design: Trusted, Industry-Standard Templates
Investor-Approved Valuation Models
MAC/PC Compatible, Fully Unlocked
No Expertise Is Needed; Easy To Follow
HNI Corporation (HNI) Bundle
You're looking at HNI Corporation's competitive footing right now, late in 2025, as they stand on the brink of closing that massive Steelcase deal, which is set to reshape the industry. Honestly, the landscape is a tug-of-war: while the company just posted a solid $1.10 non-GAAP diluted EPS in Q3, keeping them on track for that mid-teens percent full-year growth goal, the power of their customers demanding discounts and volatile raw material costs are definitely biting. We need to see how the coming integration, which promises an extra $1.20 per share in future accretion on top of the $0.75 to $0.80 expected from KII synergies, will offset these immediate pressures and the long-term threat of hybrid work models. Below, I break down exactly where the leverage lies across all five forces for HNI Corporation.
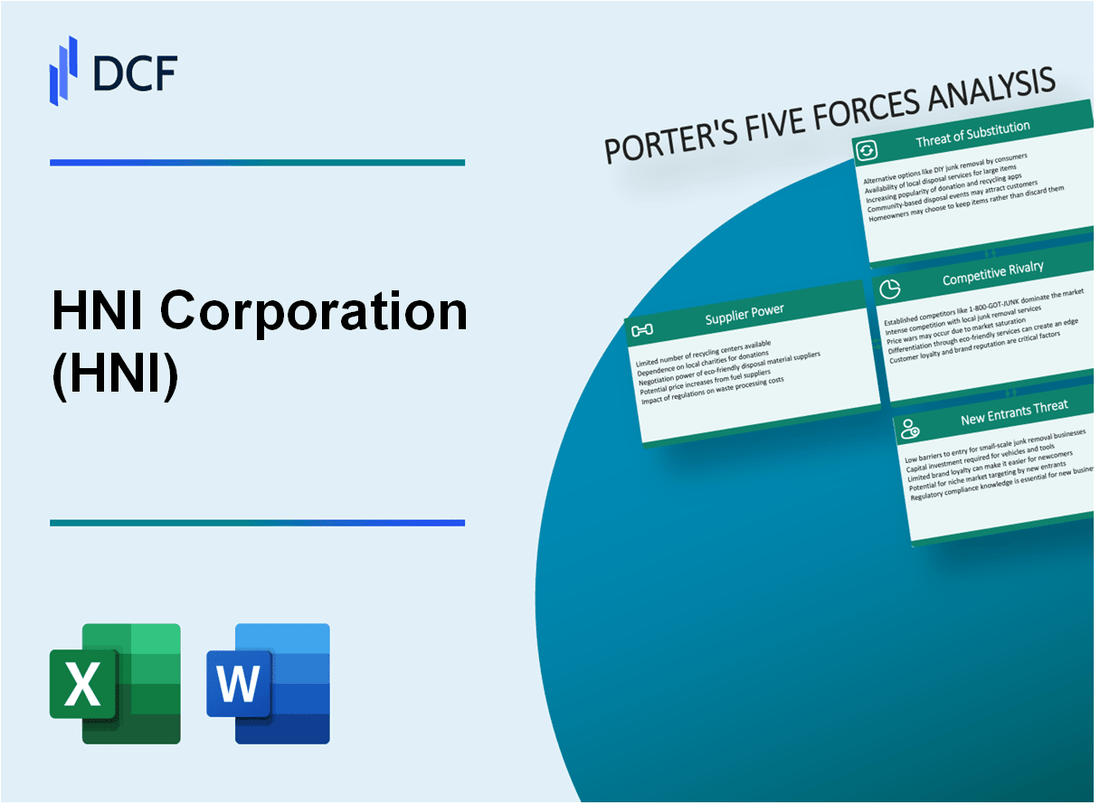
HNI Corporation (HNI) - Porter's Five Forces: Bargaining power of suppliers
Raw material price volatility definitely impacts profitability for HNI Corporation, as noted in their 2024 Annual Report, which cited fluctuations in commodity costs as a risk factor. The tariff environment in 2025 introduced significant input cost pressure. Specifically, steel and aluminum tariffs doubled to 50% in June 2025 for most countries. Prior to this increase, the initial 25% tariffs enacted in March 2025 were estimated by industry sources to potentially cause steel prices to rise by 8.2% and aluminum costs to climb by 5.7%. The price difference for steel between the US and the EU increased by 77% between February 7 and May 23, 2025, due to these measures.
HNI Corporation's large scale provides some counter-leverage in procurement, though direct supplier power metrics are not public. However, the company is actively realizing cost benefits from its strategic integrations. Total cost synergies associated with the Kimball International, Inc. (KII) acquisition now total an estimated \$50 million, which includes approximately \$4 million of new cost synergies related to ongoing procurement efforts. This focus on integration savings helps mitigate the impact of external cost inflation.
Supply chain finance programs offer suppliers better financing, improving relationships. HNI Corporation facilitates third-party supply chain finance (SCF) programs where eligible suppliers can sell their trade receivables, priced to leverage HNI Corporation's credit rating. As of March 29, 2025, the obligations due by HNI Corporation to financial institutions under these SCF programs were \$28.7 million, a slight decrease from \$31.2 million recorded on December 28, 2024.
Global supply chain disruptions remain a persistent cost and delay risk. HNI Corporation explicitly listed disruptions in the global supply chain as a risk in its 2024 filings. The Q1 2025 results noted that the company delivered an excellent start to the year despite 'tariff-driven volatility'. Dependence on a few key commodity inputs keeps input costs a defintely high risk, especially given the significant tariff actions impacting primary materials like steel and aluminum throughout 2025.
Here is a snapshot of relevant financial and statistical data points related to HNI Corporation's supply chain and input costs as of the first quarter of 2025:
| Metric | Value/Amount | Date/Period | Source Context |
|---|---|---|---|
| Supplier Finance Programs Obligations | \$28.7 million | March 29, 2025 | Balance Sheet Liability |
| Supplier Finance Programs Obligations | \$31.2 million | December 28, 2024 | Balance Sheet Liability |
| New Procurement Cost Synergies (KII Integration) | Approximately \$4 million | As of 2024/2025 Estimates | Incremental to total KII synergies |
| US Steel Price Difference Increase (vs. EU) | 77% | Feb 7 to May 23, 2025 | Impact of tariffs |
| Estimated Steel Price Rise (from 25% tariffs) | 8.2% | Industry Estimate | Pre-50% tariff impact context |
| Estimated Aluminum Cost Rise (from 25% tariffs) | 5.7% | Industry Estimate | Pre-50% tariff impact context |
| Largest Customer Sales Concentration | 15% | Fiscal Year 2024 | No single customer accounted for 10% or more |
You should note the following key supplier-related dynamics:
- Tariffs on steel and aluminum doubled to 50% in June 2025.
- HNI Corporation expects to offset the majority of tariff pressures for full year 2025.
- SCF obligations decreased by \$2.5 million between year-end 2024 and Q1 2025.
- The company's overall cost structure is being actively managed through integration savings, including \$4 million in procurement synergies.
- The risk of raw material cost increases was explicitly cited in the 2024 Annual Report.
HNI Corporation (HNI) - Porter's Five Forces: Bargaining power of customers
You're analyzing HNI Corporation's customer dynamics as the company navigates a major acquisition and evolving market conditions in late 2025. The power your customers hold over HNI Corporation is a key lever in margin management, especially across its two distinct segments.
Large contract customers and government clients demand higher discounts. We saw direct evidence of this pressure in the first quarter of 2025, where stronger volume from large projects and state/local government customers-which typically require deeper price concessions-was explicitly noted as dilutive to segment operating margin. This means that while securing large volume is good for top-line revenue, the price paid erodes immediate profitability, forcing HNI Corporation to rely on productivity gains to offset it.
Workplace Furnishings relies heavily on independent dealers, increasing channel power. HNI Corporation lists its reliance on its network of independent dealers as a stated business risk. This channel structure means dealers, as intermediaries, have leverage in negotiating terms, pricing, and inventory allocation. To be fair, the Residential Building Products side shows a degree of vertical integration that mitigates this specific channel risk there; approximately one quarter of that segment's revenue comes from products and services sold through owned installing distributors. Still, the overall dependence on the independent dealer network in the larger Workplace Furnishings segment remains a significant factor in customer power.
Customers face low switching costs between major office furniture brands. The sheer scale of the proposed acquisition of Steelcase Inc. by HNI Corporation, with shareholder votes scheduled for December 5, 2025, and an anticipated close in mid-December 2025, underscores the intense rivalry in the commercial space. When industry consolidation happens at this level, it often signals that retaining existing customers-who can easily pivot to a competitor if terms aren't right-is paramount, suggesting that switching costs for end-users between major players are relatively low.
The company's diverse brand portfolio mitigates power from any single customer segment. HNI Corporation's structure, splitting between Workplace Furnishings and the Residential Building Products (hearth) business, provides inherent diversification. For instance, in Q2 2025, Workplace Furnishings generated net sales of $516.0 million, while Residential Building Products brought in $151.1 million, out of total net sales of $667.1 million. Furthermore, within the Workplace Furnishings segment, management noted growth across all major brands in Q2 2025, suggesting that no single brand is solely responsible for revenue, which diffuses power from any one large customer group within that division.
Residential Building Products demand is sensitive to high interest rates and builder sentiment. This segment's performance is tied directly to housing activity, which is highly sensitive to macro factors. In Q1 2025, management specifically pointed out that higher mortgage rates and decreased housing affordability had negatively impacted demand for both new construction and remodel/retrofit work. This sensitivity means that when the housing market cools, customer demand weakens, which inherently shifts bargaining power toward the builders and remodelers purchasing HNI Corporation's products. The segment's performance reflects this volatility; after growing 7.1% in Q1 2025, net sales were flat year-over-year in Q3 2025.
Here's a quick look at the segment revenue contribution based on Q2 2025 results:
| Metric | Workplace Furnishings | Residential Building Products | Total HNI Corporation |
| Net Sales (Q2 2025, in millions) | $516.0 | $151.1 | $667.1 |
| Segment Operating Profit Margin (Q2 2025) | 12.8% (GAAP) | 15.7% | N/A |
| Revenue Source Detail | Reliance on independent dealers noted as risk | Approx. one quarter of revenue from owned distributors | Synergies/efficiencies projected to add $0.75 to $0.80 to 2025-2026 EPS |
The company is actively working to strengthen its position against customer demands through internal efficiencies. The combined savings from the Kimball International (KII) integration and the Mexico facility ramp-up are projected to contribute between $0.75 to $0.80 to diluted non-GAAP Earnings Per Share (EPS) over the 2025-2026 period.
You should watch for any public statements regarding contract volume versus margin realization in the upcoming Q4 2025 filings, as that will be the clearest indicator of how successfully HNI Corporation is pushing back on discount demands from its largest buyers.
HNI Corporation (HNI) - Porter's Five Forces: Competitive rivalry
The competitive rivalry within the office furniture sector remains intense, facing major players such as MillerKnoll across various segments. The overall Office Furniture Market size is estimated at USD 78.10 billion in 2025 globally, projected to grow at a 6.89% CAGR through 2030.
The pending acquisition of Steelcase (SCS) by HNI Corporation, valued at approximately $2.2 billion in a cash and stock transaction announced on August 4, 2025, will consolidate the market significantly. This transaction is expected to close before the end of calendar 2025.
The structure of the deal dictates that upon closing, HNI shareholders will own roughly 64% of the combined organization, while Steelcase shareholders will hold the remaining 36%. This combination anticipates generating pro forma annual revenue of approximately $5.8 billion and projected annual run-rate synergies of $120 million.
Rivalry is high, partly due to the mature nature of office furniture markets, though the U.S. market is still expected to grow from an estimated USD 17.43 billion in 2025 to USD 22.24 billion by 2030, representing a 5.0% CAGR from 2025 to 2030.
HNI Corporation is driving internal financial outperformance, confirming expectations for a fourth consecutive year of double-digit non-GAAP earnings improvement. The company explicitly projects mid-teens percent diluted non-GAAP EPS growth for the full year 2025.
Here's a look at recent non-GAAP EPS performance and outlook:
| Period | Non-GAAP Diluted EPS | Year-over-Year Change |
| Q1 2025 | $0.44 | +19% |
| Q3 2025 | $1.10 | +7% |
| Full Year 2024 (Actual) | $3.06 | +15% |
The company's competitive positioning relies on specific operational strengths:
- Brand reputation.
- Distribution network.
- Product innovation.
The expected synergies from the Steelcase acquisition, along with savings from the KII acquisition and the Mexico facility ramp-up, are expected to contribute a total of $0.75 to $0.80 to diluted non-GAAP EPS across 2025-2026.
HNI's gross debt leverage is targeted to return to the range of 1 to 1.5x within 18 to 24 months following the acquisition close, having stood at 0.9x after reducing debt by $120 million in Q3 2025.
HNI Corporation (HNI) - Porter's Five Forces: Threat of substitutes
You're looking at how external pressures could erode HNI Corporation's core business, and the threat of substitutes is definitely a major factor, especially with how work and home life have shifted.
Remote work and hybrid models are a long-term substitute for commercial office furniture. While HNI Corporation's Workplace Furnishings segment is still seeing some activity-orders were up 2% year-over-year in the third quarter of 2025, excluding certain customer pull-ins-the underlying trend is a move away from traditional, full-time office setups. Data suggests that increased space-sharing practices, up 30% since 2021 among corporate real estate executives, allow organizations to report up to 30% real-estate cost savings after reconfiguration. This dynamic puts pressure on the overall volume needed for the office furniture market, which stands at an estimated $78.10 billion in 2025. It's a big market, projected to hit $109 billion by 2030, but the need for HNI Corporation's specific product mix is being challenged by less physical space being utilized full-time.
Residential Building Products face substitution from alternative heating solutions, though HNI Corporation's hearth business seems relatively insulated for now. The modern hearth market, which includes HNI Corporation's gas, electric, and wood-burning fireplaces, is valued at approximately $2.5 billion in 2025 and is projected to grow at a Compound Annual Growth Rate (CAGR) of 5% through 2033. This suggests that while other energy sources exist, the demand for aesthetically pleasing and energy-efficient hearths remains strong, especially since the Residential Building Products segment orders grew 8% in the first quarter of 2025, even though Q3 performance was described as 'stable.'
E-commerce platforms allow for easier access to lower-cost, non-contract furniture alternatives. This is a direct threat to HNI Corporation's contract-focused sales channels. While B2B/direct sales commanded a 71.4% share of the office furniture market in 2024, the B2C online channels are rising fast, showing a 7.6% CAGR through 2030. If smaller firms or individuals furnishing home offices bypass traditional dealer networks, they often opt for less expensive, non-contract-grade items, increasing the pool of substitutes available online.
The $0.70 to $0.80 incremental Earnings Per Share (EPS) from KII synergies helps fund product differentiation. HNI Corporation continues to realize significant savings from the Kimball International (KII) acquisition integration and its Mexico facility ramp-up. These two initiatives are collectively expected to contribute between $0.75 to $0.80 to diluted non-GAAP EPS across the 2025-2026 period. This financial cushion is critical; it allows HNI Corporation to invest in higher-value products that can better withstand substitution pressure from cheaper alternatives.
High-quality, ergonomic contract furniture maintains a strong value proposition for large firms. This is HNI Corporation's defense against the low-cost threat. While the economy pricing tier still accounted for 52% of the office furniture market size in 2024, the premium furniture segment is expanding at an 8.1% CAGR through 2030. This indicates that large corporate clients, despite hybrid work, are prioritizing better, more ergonomic solutions to entice employees back to the office. HNI Corporation's Q3 2025 non-GAAP operating margin hit 10.8%, the highest for a third quarter, which reflects successful execution on profit transformation and pricing, supporting the ability to compete on quality.
- Q3 2025 Non-GAAP diluted EPS: $1.10.
- Q3 2025 Net Sales: $683.8 million.
- Workplace Furnishings Q3 2025 Net Sales: $516.9 million.
- Expected KII/Mexico Synergy EPS contribution (2025-2026): $0.75 to $0.80.
- Office Furniture Market Size (2025 Est.): $78.10 billion.
| HNI Segment/Market Area | Metric | Value/Rate | Timeframe/Context |
| Office Furniture Market | Estimated Size | $78.10 billion | 2025 |
| Office Furniture Market | Projected CAGR | 6.89% | 2025-2030 |
| Office Furniture Market (Price Tier) | Economy Tier Share | 52% | 2024 |
| Office Furniture Market (Price Tier) | Premium Furniture CAGR | 8.1% | Through 2030 |
| B2C Online Channels (Office Furniture) | CAGR | 7.6% | Through 2030 |
| Hearth Market (Residential Products) | Estimated Size | $2.5 billion | 2025 |
| Hearth Market | Projected CAGR | 5% | 2025-2033 |
| Hearth Market (Geography) | North America Share | ~60% | Current |
The ability of HNI Corporation to offset these substitution threats hinges on its internal execution, like realizing that $0.70 to $0.80 in synergy-driven EPS. Finance: draft the 13-week cash view by Friday to monitor liquidity against potential dips in commercial demand.
HNI Corporation (HNI) - Porter's Five Forces: Threat of new entrants
You're looking at HNI Corporation (HNI) and wondering how tough it is for a new player to muscle in on their turf, especially with that massive Steelcase deal pending. Honestly, the barriers to entry here are substantial, built up over decades of capital deployment and network development.
Significant capital investment is required for manufacturing and distribution scale.
To compete effectively in workplace furnishings or hearth products, a new entrant needs serious upfront cash. Think about the scale HNI operates at; their Trailing Twelve Month (TTM) Net Sales, as of Q3 2025, hit $2.6B. That kind of revenue base requires massive, efficient production capacity. HNI Corporation's own investment in physical assets shows the baseline; for the period ending March 29, 2025, their total Capital Expenditures (CapEx) were $16.3 million. This figure covers both segments, Workplace Furnishings ($11.0M) and Residential Building Products ($3.2M), plus general corporate spending ($2.0M). Furthermore, HNI is actively investing in optimization, like ramping up a new facility in Mexico, with total expected savings from that and KII synergies reaching $80-85 million through 2026. A new entrant must match or exceed this level of investment just to achieve cost parity, let alone scale.
| Metric | HNI Corporation (as of late 2025 Data) | Unit |
|---|---|---|
| Trailing Twelve Month Net Sales (TTM) | 2.6B | USD |
| Total Capital Expenditures (Q1 2025) | 16.3M | USD |
| Expected Synergy Savings (2025-2026) | 80-85M | USD |
| Steelcase Acquisition Consideration | 2.2B | USD |
Established brand loyalty and dealer networks create high distribution barriers.
Brand equity is a huge moat here. In the hearth business, HNI's brands like Heatilator, Heat & Glo, Majestic, Monessen, and Stellar are market leaders in gas and wood fireplaces. Building that level of trust takes years. Distribution is just as sticky. HNI's Hearth & Home unit sells through independent dealers, distributors, and 28 Corporation-owned installing distribution and retail outlets under the Fireside Hearth & Home brand. For the workplace segment, HNI relies on an extensive dealer network that provides localized service-something a startup simply cannot replicate overnight. The pending acquisition of Steelcase, which also has established dealer networks, only entrenches this barrier further for any potential new competitor.
The pending Steelcase merger creates an even larger, more formidable incumbent.
The announced acquisition of Steelcase Inc. by HNI Corporation is a game-changer for industry concentration. The deal valued Steelcase at approximately $2.2 billion in cash and stock. Once closed, expected by the end of calendar year 2025, the combined entity will see HNI shareholders owning approximately 64% and Steelcase shareholders owning about 36%. This consolidation means fewer, but much larger, established players dominating the market share, making it significantly harder for a new entrant to gain traction against the combined scale and complementary brand portfolios.
New entrants can easily target niche product lines or direct-to-consumer e-commerce.
To be fair, the threat isn't zero. New entrants often find success by avoiding direct confrontation with the incumbents' core, high-volume channels. You see this play out in two main areas. First, niche product lines within the Workplace Furnishings segment, perhaps highly specialized ergonomic seating or unique modular systems for micro-offices, offer an opening. Second, the direct-to-consumer (D2C) e-commerce channel remains an avenue. HNI itself uses e-commerce retailers for its Residential Building Products segment, suggesting that a digitally native brand focused purely on online sales, bypassing the traditional dealer network entirely, could find a foothold, though they'd still face HNI's established brand recognition in that space.
- Targeting specific, underserved commercial sub-markets.
- Focusing on D2C sales channels for residential products.
- Developing proprietary, highly differentiated material technology.
- Leveraging lower overhead from a purely digital sales model.
Regulatory and environmental compliance adds cost complexity for new manufacturers.
Manufacturing in the U.S. comes with a heavy compliance overhead that disproportionately affects smaller, newer firms. The total cost of federal regulations in 2022 was estimated at $3.079 trillion across the U.S. economy. For a small manufacturer, the burden is immense; environmental compliance costs alone averaged $40,700 per employee in 2022, compared to $12,500 for larger firms. New entrants must immediately budget for things like EPA's TSCA Title VI standards for composite wood materials and CPSC safety requirements for children's furniture. Navigating this complex web of rules requires specialized staff or expensive consultants, immediately inflating the initial operating expenses before a single product is sold profitably.
Disclaimer
All information, articles, and product details provided on this website are for general informational and educational purposes only. We do not claim any ownership over, nor do we intend to infringe upon, any trademarks, copyrights, logos, brand names, or other intellectual property mentioned or depicted on this site. Such intellectual property remains the property of its respective owners, and any references here are made solely for identification or informational purposes, without implying any affiliation, endorsement, or partnership.
We make no representations or warranties, express or implied, regarding the accuracy, completeness, or suitability of any content or products presented. Nothing on this website should be construed as legal, tax, investment, financial, medical, or other professional advice. In addition, no part of this site—including articles or product references—constitutes a solicitation, recommendation, endorsement, advertisement, or offer to buy or sell any securities, franchises, or other financial instruments, particularly in jurisdictions where such activity would be unlawful.
All content is of a general nature and may not address the specific circumstances of any individual or entity. It is not a substitute for professional advice or services. Any actions you take based on the information provided here are strictly at your own risk. You accept full responsibility for any decisions or outcomes arising from your use of this website and agree to release us from any liability in connection with your use of, or reliance upon, the content or products found herein.