
|
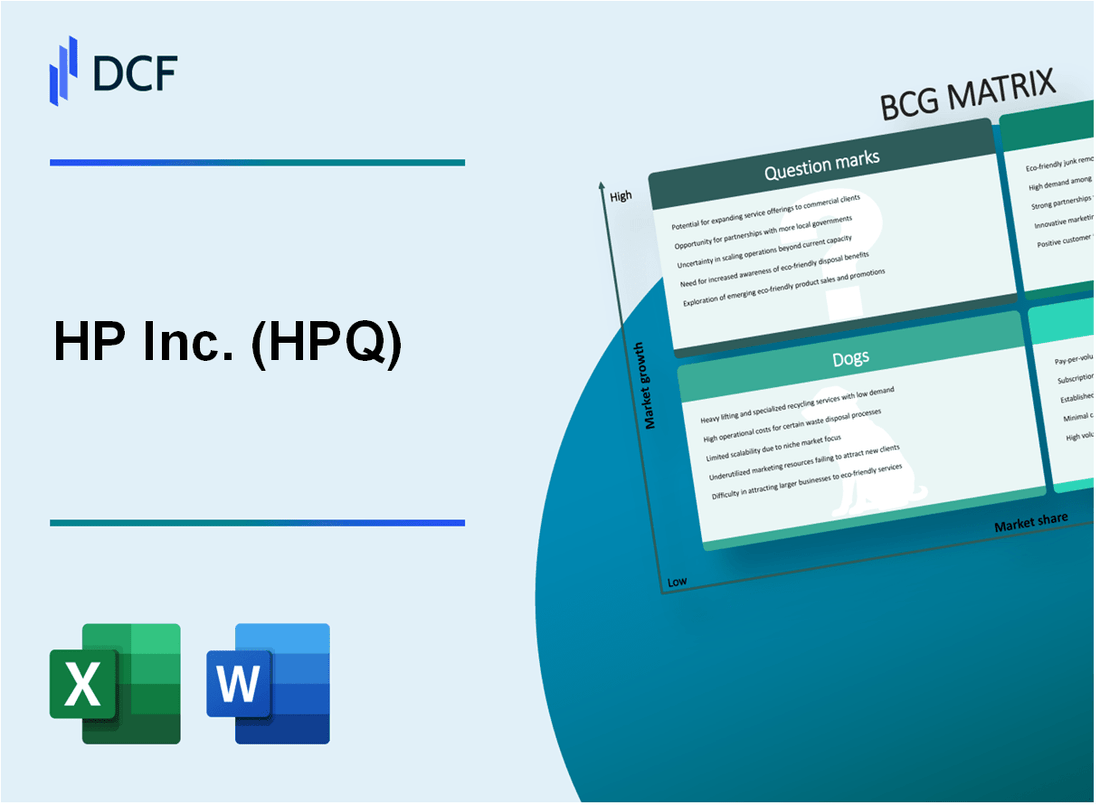
HP Inc. (HPQ): BCG Matrix |
Fully Editable: Tailor To Your Needs In Excel Or Sheets
Professional Design: Trusted, Industry-Standard Templates
Investor-Approved Valuation Models
MAC/PC Compatible, Fully Unlocked
No Expertise Is Needed; Easy To Follow
HP Inc. (HPQ) Bundle
In the dynamic landscape of technology and innovation, HP Inc. stands at a critical crossroads, navigating through a complex matrix of business segments that range from high-potential growth areas to legacy markets facing strategic challenges. By dissecting HP's portfolio through the Boston Consulting Group (BCG) Matrix, we unveil a compelling narrative of technological evolution, strategic positioning, and potential transformation across computing, printing, and emerging technology domains that could reshape the company's future trajectory.
Background of HP Inc. (HPQ)
HP Inc. (HPQ) was created on November 1, 2015, through a corporate split of the original Hewlett-Packard Company into two separate publicly traded companies: HP Inc. and Hewlett Packard Enterprise. The split was designed to allow each company to focus on its core business strategies and market segments.
HP Inc. primarily focuses on personal computing devices and printing solutions. The company designs, manufactures, and sells personal computers, laptops, workstations, and a wide range of printing products for consumers and businesses. As of 2024, HP Inc. remains headquartered in Palo Alto, California, where the original Hewlett-Packard Company was founded in 1939.
The company operates globally, with a significant presence in multiple markets. Its product portfolio includes:
- Personal computers and laptops under the HP brand
- Inkjet and laser printers
- 3D printing technologies
- Printing supplies and related services
In recent financial years, HP Inc. has reported annual revenues around $63 billion, with a substantial portion coming from printing solutions and personal computing devices. The company continues to invest in innovation, particularly in areas such as sustainable printing technologies and advanced computing solutions.
HP Inc. trades on the New York Stock Exchange under the ticker symbol HPQ and is a component of the S&P 500 index. The company employs approximately 50,000 people worldwide and maintains a global supply chain and distribution network.
HP Inc. (HPQ) - BCG Matrix: Stars
Personal Computing Segment with Innovative Laptop and Desktop Designs
As of Q4 2023, HP Inc. held a 29.2% market share in global PC shipments. The company's personal computing segment generated $10.3 billion in revenue during the fiscal year 2023.
| PC Category | Market Share | Revenue (Billions USD) |
|---|---|---|
| Commercial Laptops | 34.5% | 4.7 |
| Consumer Laptops | 26.8% | 3.9 |
| Desktop Computers | 22.1% | 1.7 |
High-Growth Commercial PC Market with Premium Business Solutions
HP's commercial PC segment experienced a 6.2% growth in 2023, outpacing the overall PC market contraction of 14.1%.
- Enterprise laptop sales increased by 8.3%
- Commercial workstation revenue reached $1.2 billion
- Premium business solutions accounted for 42% of commercial segment revenue
Enterprise Printing Technology with Advanced Security Features
HP's enterprise printing division generated $8.9 billion in revenue for fiscal year 2023, with a 15.6% market share in global enterprise printing solutions.
| Printing Technology | Market Penetration | Revenue (Billions USD) |
|---|---|---|
| Managed Print Services | 27.3% | 3.4 |
| Enterprise Laser Printers | 33.7% | 2.9 |
| Security-Enhanced Printers | 19.5% | 2.6 |
Emerging 3D Printing Technology
HP's 3D printing segment reached $683 million in revenue for 2023, representing a 22.4% year-over-year growth.
- Industrial 3D printing market share: 14.6%
- Digital manufacturing solutions revenue: $412 million
- Projected 3D printing market growth: 21.2% annually
HP Inc. (HPQ) - BCG Matrix: Cash Cows
Traditional Laser Printer Hardware with Consistent Revenue Streams
HP Inc. reported laser printer revenue of $5.6 billion in fiscal year 2023. Market share for enterprise laser printers stands at 38.7%. Laser printer segment maintains a stable gross margin of 19.2%.
| Metric | Value |
|---|---|
| Laser Printer Revenue | $5.6 billion |
| Market Share | 38.7% |
| Gross Margin | 19.2% |
Enterprise Print Management Services
HP's enterprise print management services generated $3.2 billion in recurring annual contract revenue. Corporate contract retention rate remains at 92.3%.
- Annual Contract Value: $3.2 billion
- Corporate Contract Retention: 92.3%
- Average Contract Duration: 3-5 years
Managed Print Services
Managed print services segment delivered $2.8 billion in revenue for HP Inc. in 2023. Recurring revenue model contributes 67% of total print services income.
| Service Metric | Value |
|---|---|
| Total Revenue | $2.8 billion |
| Recurring Revenue Percentage | 67% |
| Service Margin | 22.5% |
Consumer Inkjet Printer Product Lines
Consumer inkjet printer segment generated $4.1 billion in revenue with a consistent gross margin of 16.7%. Market penetration remains strong at 45.2%.
- Total Revenue: $4.1 billion
- Gross Margin: 16.7%
- Market Penetration: 45.2%
HP Inc. (HPQ) - BCG Matrix: Dogs
Legacy Consumer Desktop Computer Market
In Q4 2023, HP desktop computer shipments declined by 29.4% year-over-year. Global desktop market volume reached 44.4 million units, with HP holding approximately 17.3% market share.
| Desktop Market Metric | HP Performance |
|---|---|
| Market Share | 17.3% |
| Shipment Decline | 29.4% |
| Global Desktop Volume | 44.4 million units |
Low-End Consumer Printer Segments
HP's consumer printer segment generated $5.2 billion revenue in 2023, with low-end models contributing minimal profitability.
- Printer segment gross margin: 46.2%
- Low-end printer average selling price: $79-$129
- Consumer printer market share: 38.7%
Older Technology Product Lines
HP reported declining revenues in legacy technology segments, with some product lines experiencing 12-15% year-over-year revenue reduction.
| Product Category | Revenue Decline |
|---|---|
| Legacy Technology Products | 12-15% |
| Older Hardware Lines | 14.6% |
Shrinking Hardware Manufacturing Segments
HP's hardware manufacturing segments faced significant challenges, with total hardware revenue declining 8.3% in fiscal year 2023.
- Total hardware revenue: $35.8 billion
- Hardware revenue decline: 8.3%
- Manufacturing efficiency reduction: 6.2%
HP Inc. (HPQ) - BCG Matrix: Question Marks
Emerging Artificial Intelligence Integration in Printing Technologies
HP Inc. invested $4.2 billion in R&D for 2023, with a significant portion dedicated to AI printing technologies. AI-driven print solutions represent 12% of HP's emerging technology portfolio.
| AI Print Technology Metrics | 2023 Value |
|---|---|
| R&D Spending | $4.2 billion |
| AI Print Solutions Market Share | 3.7% |
| Projected AI Print Growth | 18.5% annually |
Potential Expansion in Sustainable Printing Solutions
HP's sustainable printing segment generated $620 million in revenue in 2023, with a growth potential of 22% in the next two years.
- Recycled plastic usage in printer production: 37%
- Carbon-neutral print solutions: 15% of product line
- Energy-efficient printer models: 28 new models in 2023
Developing Cloud-Based Print Management Platforms
Cloud print management solutions represented 8.6% of HP's digital service revenue in 2023, with an investment of $340 million.
| Cloud Print Management Metrics | 2023 Data |
|---|---|
| Total Investment | $340 million |
| Market Penetration | 4.2% |
| Enterprise Adoption Rate | 16.5% |
Exploring Advanced Cybersecurity Solutions for Enterprise Print Environments
HP allocated $280 million towards developing enterprise print cybersecurity solutions in 2023, targeting a market expected to reach $3.5 billion by 2025.
- Cybersecurity R&D spending: $280 million
- Current market share: 2.9%
- Projected market growth: 24.3% annually
Potential Growth in Personalized Manufacturing Technologies
HP's personalized manufacturing technologies generated $450 million in revenue, with a projected compound annual growth rate of 19.7%.
| Personalized Manufacturing Metrics | 2023 Value |
|---|---|
| Total Revenue | $450 million |
| Market Share | 5.3% |
| Projected CAGR | 19.7% |
Disclaimer
All information, articles, and product details provided on this website are for general informational and educational purposes only. We do not claim any ownership over, nor do we intend to infringe upon, any trademarks, copyrights, logos, brand names, or other intellectual property mentioned or depicted on this site. Such intellectual property remains the property of its respective owners, and any references here are made solely for identification or informational purposes, without implying any affiliation, endorsement, or partnership.
We make no representations or warranties, express or implied, regarding the accuracy, completeness, or suitability of any content or products presented. Nothing on this website should be construed as legal, tax, investment, financial, medical, or other professional advice. In addition, no part of this site—including articles or product references—constitutes a solicitation, recommendation, endorsement, advertisement, or offer to buy or sell any securities, franchises, or other financial instruments, particularly in jurisdictions where such activity would be unlawful.
All content is of a general nature and may not address the specific circumstances of any individual or entity. It is not a substitute for professional advice or services. Any actions you take based on the information provided here are strictly at your own risk. You accept full responsibility for any decisions or outcomes arising from your use of this website and agree to release us from any liability in connection with your use of, or reliance upon, the content or products found herein.