
|
HP Inc. (HPQ): 5 FORCES Analysis [Nov-2025 Updated] |
Fully Editable: Tailor To Your Needs In Excel Or Sheets
Professional Design: Trusted, Industry-Standard Templates
Investor-Approved Valuation Models
MAC/PC Compatible, Fully Unlocked
No Expertise Is Needed; Easy To Follow
HP Inc. (HPQ) Bundle
You're looking for a clear-eyed view of HP Inc.'s competitive moat as of late 2025, and honestly, the landscape is tight. We see customer power biting hard, reflected in that 5.8% Personal Systems operating margin in Q4 FY25, driven by commercial buyers making up 67% of that segment's revenue. Plus, the rivalry with Lenovo and Dell is fierce in a mature PC market, even as the company bets big on AI PCs, which already accounted for over 30% of Q4 FY25 shipments. Before you make your next move, dive into this precise five-forces breakdown to see exactly where the pressure points-from suppliers to new entrants-are hitting HPQ right now.
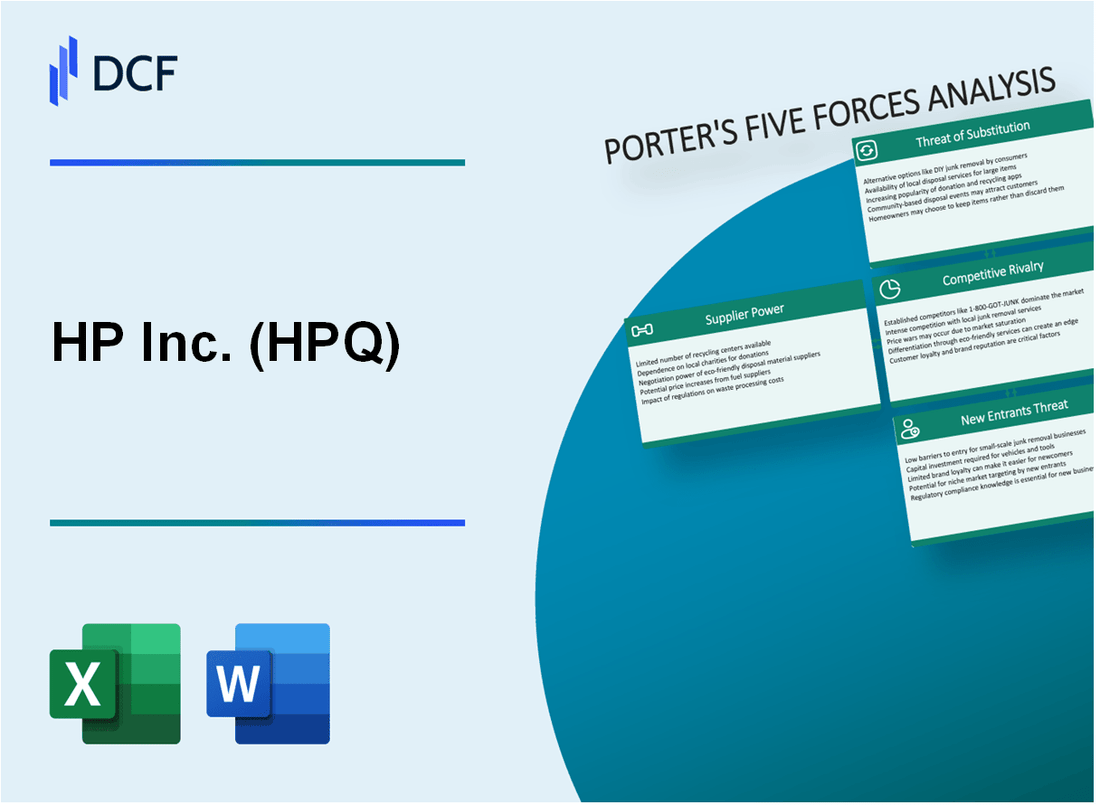
HP Inc. (HPQ) - Porter's Five Forces: Bargaining power of suppliers
When you look at HP Inc.'s supplier landscape as of late 2025, you see a classic tension: massive scale versus concentrated, high-value component markets. The power held by key suppliers is definitely rising, driven by commodity inflation and the critical nature of their technology.
The most immediate pressure point is memory. As President and CEO Enrique Lores noted during the Q4 results, memory costs are currently sitting between 15% to 18% of a typical PC's cost. What's concerning is that the rate of this increase has accelerated recently, creating an expected ~$0.30 EPS headwind for fiscal year 2026, even after factoring in mitigation efforts. This commodity spike directly increases supplier leverage.
To manage this, HP Inc. is actively trying to stretch its payment terms, which is a clear signal of pressure being pushed downstream. We saw Accounts Payable (AP) reach $18.1 billion at the end of Q4 Fiscal 2025. Looking at the Days Payable Outstanding (DPO), which tells us how long HP takes to pay its bills, it was 139 days in Q4 FY25. This is up from 138 days at the end of Q4 FY24, and up from 132.50 days in Q3 FY25. While the prompt mentioned a 7-day increase leading into Q4 FY24, the trend shows HP is maintaining or slightly extending these longer payment cycles, which is a direct negotiation tactic against suppliers. Honestly, stretching payables by even a day or two when you're dealing with billions in spend is a big deal.
Here's a quick look at the financial metrics showing this cost and payment dynamic:
| Metric | Value (Q4 FY25) | Comparison/Context |
|---|---|---|
| Memory Cost as % of PC Cost | 15% to 18% | Spiking input cost |
| FY26 EPS Headwind (Net of Mitigations) | ~$0.30 | Attributed to memory costs |
| Accounts Payable (End of Q4 FY25) | $18.1 billion | Up $0.2 billion from Q3 FY25 |
| Days Payable Outstanding (DPO) (Q4 FY25) | 139 days | Up 1 day Quarter-over-Quarter |
The structure of the PC market means HP cannot easily walk away from certain foundational suppliers. The dominance of a few key players-think about the core microprocessor architecture from companies like Intel, or the operating system from Microsoft-creates high switching costs. If you are designing a new generation of AI PCs, which now represent over 30% of HP's shipments, you are locked into that CPU/GPU ecosystem for the product's lifecycle. That's not a simple swap; it's deep intellectual property integration.
HP Inc. is fighting back, though. They are using their massive scale and actively working to reduce reliance on single sources. You see this play out in several ways:
- Qualifying additional, lower-cost memory suppliers.
- Redesigning the product portfolio for reduced memory configurations.
- Diversifying the manufacturing base, including shifting production outside of China.
- Exploring new manufacturing commitments, such as in Saudi Arabia.
Still, the immediate leverage remains with the component makers controlling the cutting-edge silicon and memory needed for the AI transition. Finance: draft a sensitivity analysis on a further 5% memory cost increase for FY26 by next Tuesday.
HP Inc. (HPQ) - Porter's Five Forces: Bargaining power of customers
When looking at HP Inc. (HPQ), the power held by its customers is a defining characteristic, particularly in the Personal Systems segment where volume dictates terms. You see this dynamic play out clearly in the structure of their sales.
Commercial Customers and Volume Leverage
Commercial customers, the large enterprises and organizations, wield significant leverage because they represent the lion's share of the Personal Systems revenue base. For the fourth quarter of fiscal year 2025, the Commercial PS segment accounted for 67% of the total Personal Systems revenue. When a buyer controls two-thirds of a division's top line, their ability to negotiate pricing and terms is inherently high. This is simply the math of large-volume purchasing power at work.
Consumer Price Sensitivity and Margin Pressure
On the consumer side, the power comes from ease of exit. Switching costs for a standard consumer PC or printer are quite low; you can walk into a competitor's store or click over to another website easily. This low barrier drives what we see in the financial results: intense price competition. This pressure is directly reflected in the segment's profitability. For Q4 FY25, the Personal Systems operating margin settled at 5.8%. Honestly, that margin level, while showing sequential improvement, reflects the constant need for HP Inc. to balance volume with price to keep customers buying.
Quantifying Customer Power in Personal Systems
Here's a quick look at the Q4 FY25 revenue split in Personal Systems, which helps illustrate where that negotiating power is concentrated:
| Customer Segment | Q4 FY25 Revenue Share (Personal Systems) | Q4 FY25 Revenue Growth (Y/Y) |
| Commercial PS | 67% | 7% |
| Consumer PS | 33% | 10% |
What this table shows you is that while Consumer revenue grew faster in the quarter, the Commercial base remains the anchor, giving those large buyers the upper hand in annual contract negotiations.
Printing Segment Deferral Tactics
In the Printing segment, customer power manifests as patience, or the ability to delay capital expenditure. The market softness HP Inc. noted globally in Q4 FY25 is a direct result of customers choosing to hold onto existing hardware longer. This customer deferral is evident when you look at the unit volumes versus the revenue. For the fourth quarter of fiscal 2025, total Printing hardware units were down a significant 12% year-over-year, even though the overall Printing net revenue only declined by 4%. That gap-the double-digit drop in units versus the single-digit drop in revenue-tells you customers are stretching the life of their current machines, which is a classic sign of strong buyer power over replacement timing.
HP Inc.'s Counter-Strategy: Differentiation
To combat this inherent customer power, HP Inc. is actively trying to change the value equation through product differentiation, moving away from commodity pricing. The primary action here is the aggressive push into premium and AI-enabled devices. By the end of Q4 FY25, AI PCs represented more than 30% of HP's Personal Systems shipments. This shift is strategic; these premium products command higher Average Selling Prices (ASPs) and, ideally, carry better margins, making customers less likely to switch based on price alone. Furthermore, the company has a clear goal to increase AI PC penetration to between 40% and 50% by the end of fiscal year 2026. This focus on high-value, differentiated technology is the direct action taken to reduce the bargaining power of customers who are otherwise highly sensitive to price.
You should watch the attach rate of services to these new AI PCs; that's where the long-term value capture happens.
HP Inc. (HPQ) - Porter's Five Forces: Competitive rivalry
You're looking at a market where HP Inc. is fighting tooth and nail for every percentage point, especially in Personal Systems. The rivalry here is definitely intense because the PC market itself is mature and, frankly, slowing down, which means rivals must compete aggressively on price and features just to maintain ground. Lenovo is the current market leader, but HP Inc. holds a significant position, with reports citing a 19.9% share at one point in 2025, placing it second in the global shipment rankings. This forces HP Inc. to constantly balance volume against margin protection.
The competitive dynamics in the PC space are clearly laid out by the latest shipment data from IDC for Q3 FY25, showing the tight race at the top:
| Competitor | Market Share (Q3 FY25 IDC) |
|---|---|
| Lenovo | 25.6% |
| HP Inc. | 19.8% |
| Dell | 13.3% |
| Apple | 9.0% |
This rivalry isn't just about unit volume; it's about winning the next platform shift. The focus on AI PCs is the key differentiation battleground right now. HP Inc. reported that demand for these new machines is accelerating, with AI PCs representing over 30% of their shipments in Q4 FY25. This signals that the fight is moving from traditional specs to on-device intelligence and features, where HP Inc. is trying to pull ahead.
Over in the Printing segment, the rivalry remains high, though the dynamics are different. While overall printer hardware sales face market softness, HP Inc. continues to defend its highly profitable supplies market, maintaining its #1 share in that crucial revenue stream. For instance, in Q4 FY25, the Print segment delivered a strong operating margin of 18.9%, which is at the top end of HP Inc.'s long-term target range of 16% to 19%. Still, supplies revenue saw a 3% year-over-year decline in Q4 in constant currency, showing that even the profitable base is under pressure.
To combat cost headwinds-like rising memory chip prices-and fund the AI transition, HP Inc. is signaling a clear cost war. The company is investing $650 million in a new restructuring initiative, which is designed to achieve $1 billion in gross run rate savings by the end of fiscal year 2028. This plan involves cutting between 4,000 to 6,000 jobs globally, which represents about 10% of the workforce from late 2024 levels of 58,000 employees.
The competitive response from HP Inc. involves several strategic actions:
- Targeting $1 billion in annual savings by FY28.
- Incurring restructuring charges of approximately $650 million.
- Focusing AI integration on productivity (projected 40% of savings) and customer satisfaction (projected 40% of savings).
- Driving Personal Systems revenue up 8% year-over-year in Q4 FY25, outperforming the market.
HP Inc. (HPQ) - Porter's Five Forces: Threat of substitutes
You're looking at the competitive landscape for HP Inc. (HPQ) and wondering where the digital tide is pulling customers away from their core hardware and consumables. The threat of substitutes is definitely present, but the numbers show a complex picture where substitution is often partial or limited to specific use cases.
Smartphones and tablets continue to substitute for basic consumer PC tasks, especially outside of commercial use.
While the PC remains essential for deep work, mobile devices absorb a significant portion of basic digital interaction. Globally, mobile devices are projected to account for 60.9% of all website traffic in 2025, widening the gap from desktop's 35% share. To be fair, tablets play a much smaller role in this substitution; they account for <3% of worldwide web traffic. In the United States, the device split as of 2025 shows a near-even split between mobile at 47% and desktop at 50% of market share, with tablets holding just 3%. This suggests that for simple tasks, the smartphone is the primary substitute, but the PC still commands the majority share in that key market, especially when considering professional use.
Cloud computing and digital document solutions are substituting for traditional printing and supplies usage.
The move to digital workflows directly pressures the Printing segment. Cloud adoption is accelerating, pushing demand for cloud-based print management and secure document storage. This massive shift is evidenced by the capital expenditure in the underlying infrastructure: the four largest cloud providers are on track to spend more than $325 billion collectively in 2025. This investment fuels solutions that reduce the need for physical documents. For HP Inc. (HPQ), this pressure is visible in the Printing segment's top-line performance; Printing net revenue was $4.3 billion in Q4 Fiscal 2025, representing a 4% year-over-year decline. Still, the commercial segment remains critical, with Commercial Printing revenue declining 4% in Q4 FY25.
The high-margin Supplies business is vulnerable to third-party ink/toner alternatives.
The Supplies business, which carries a high operating margin, is a prime target for lower-cost substitutes. The overall Ink-Cartridge Market is estimated to be valued at USD 21.8 billion in 2025. While Genuine/OEM toners hold the largest market share due to perceived reliability, the Compatible toners segment is noted as the fastest-growing. These third-party alternatives are significantly cheaper, generally priced 30-60% less expensive than OEM ones. This pressure is reflected in HP Inc. (HPQ)'s own results: Supplies net revenue declined 4% in Q4 Fiscal 2025 and was down 2% in constant currency for the full fiscal year 2025. The Commercial end-user segment, which drives high-volume printing, is projected to account for 63.1% of ink cartridge revenue in 2025, making it a key battleground for OEM versus compatible cartridges.
The need for powerful AI PCs and workstations for hybrid work maintains a core demand for HP's main product.
The substitution threat to the Personal Systems segment is being actively countered by the premiumization and capability upgrade cycle driven by Artificial Intelligence. This demand helps maintain core hardware sales, as you can see from the segment's financial performance. Personal Systems net revenue was $10.4 billion in Q4 Fiscal 2025, marking an 8% year-over-year increase. This growth is tied to the AI PC transition. Gartner forecasts that AI PCs will represent 31% of the total PC market globally by the end of 2025, totaling 77.8 million units shipped. This indicates a significant portion of the installed base is actively refreshing to new, higher-specification hardware, which is a direct counter-force to simple device substitution.
Here are the key financial and market metrics relevant to these substitution forces:
| Metric | Value / Percentage | Context |
|---|---|---|
| HPQ FY2025 Net Revenue | $55.3 billion | Total company revenue for the fiscal year. |
| HPQ Q4 FY2025 Personal Systems Revenue | $10.4 billion | Segment revenue, up 8% YoY. |
| HPQ Q4 FY2025 Printing Revenue | $4.3 billion | Segment revenue, down 4% YoY. |
| HPQ FY2025 Supplies Revenue Change (CC) | Down 2% | Year-over-year change in constant currency. |
| Projected Global AI PC Market Share (End of 2025) | 31.0% | Percentage of total PC market. |
| Projected Global AI PC Shipments (2025) | 77.8 million units | Total units expected to ship. |
| Estimated Global Ink-Cartridge Market Value (2025) | USD 21.8 billion | Market size estimate for the year. |
| Projected Global Mobile Web Traffic (2025) | 60.9% | Share of total web traffic. |
The tension is clear: the high-value Personal Systems segment is seeing a refresh cycle driven by AI, while the Printing segment faces headwinds from digitalization and lower-cost consumables.
- Commercial PS accounted for 67% of Personal Systems Q4 FY25 revenue.
- Compatible toners are generally 30-60% less expensive than OEM.
- US Desktop/Laptop web access share was 50% in 2025.
- The four largest cloud providers' collective spending in 2025 is over $325 billion.
Finance: review Q1 2026 inventory targets against the projected low single-digit decrease in the print hardware market for 2026.
HP Inc. (HPQ) - Porter's Five Forces: Threat of new entrants
You're looking at the barriers for a new player trying to break into the personal systems and printing space dominated by HP Inc. Honestly, the threat of new entrants right now is quite low, primarily because the scale required to compete is massive.
The capital needed for global manufacturing footprint and distribution networks acts as a huge moat. Look at the broader manufacturing sector: capital expenditures are expected to increase by 5.2% in 2025, signaling continued heavy investment just to maintain or slightly expand existing operations. Furthermore, reshoring efforts mean new entrants face the incredibly capital-intensive process of building out domestic infrastructure-think power, roads, and logistics-to support production and market connection.
The established brand equity of HP Inc. itself is a significant hurdle. Brand Finance calculated the HP brand value in their 2025 Global 500 ranking at $12.0 B. That kind of recognized value doesn't get built overnight; it requires decades of market presence and marketing spend that a startup simply cannot match initially.
Technological expertise and the necessary R&D investment create another steep climb. HP Inc. spent $1.64B on Research and Development in fiscal 2024, up from $1.578B in fiscal 2023. For the twelve months ending July 31, 2025, R&D spend was $1.596B. This level of sustained, high-volume spending is necessary to keep pace.
New competitors would immediately face HP Inc.'s existing scale advantages in procurement. When you look at the sheer size of the operation-HP Inc.'s total net revenue for fiscal 2024 was $53.6 billion-it translates directly into leverage with suppliers.
Here's a quick look at the scale HP Inc. operates at, which new entrants must overcome:
| Metric | Value (Latest Available) | Year/Period |
|---|---|---|
| Total Net Revenue | $53.6 billion | Fiscal 2024 |
| R&D Expenses | $1.596B | TTM ending July 31, 2025 |
| Workforce Size | Approx. 58,000 | October 2024 |
| Brand Valuation | $12.0 B | 2025 (Interbrand) |
| Projected Manufacturing Labor Cost Increase | 3.3% | 2025 Forecast |
The industry's current technological pivot only raises the entry barrier further. The push toward AI PCs, which HP Inc. is actively restructuring for with its new Omni branding, demands substantial, forward-looking R&D investment in specialized silicon and software integration. A new entrant would need to fund this complex R&D cycle from day one, which is a massive financial ask.
HP Inc.'s ongoing efficiency drives also underscore the difficulty of competing on cost. The company is implementing job cuts of 4,000 to 6,000 employees through fiscal 2028, aiming for $1 billion in annual gross savings by 2028 by applying AI tools across development and manufacturing. This focus on extracting structural cost savings means a new player must enter with a cost structure that is immediately leaner than an established giant actively optimizing its base.
The barriers to entry are concrete, not just theoretical:
- Global supply chain integration is complex and costly.
- Securing component supply at favorable pricing is difficult.
- Brand trust takes years to cultivate and defend.
- R&D investment must match the AI PC transition curve.
- Achieving HP Inc.'s scale requires billions in upfront capital.
If you're thinking about a new venture here, you need to be prepared to spend significantly more than the $1.596B HP Inc. spent on R&D in the last twelve months just to get to parity on technology.
Finance: draft the capital expenditure comparison against the projected $3.2 to $3.6 billion Free Cash Flow range for fiscal 2025 by next Tuesday.
Disclaimer
All information, articles, and product details provided on this website are for general informational and educational purposes only. We do not claim any ownership over, nor do we intend to infringe upon, any trademarks, copyrights, logos, brand names, or other intellectual property mentioned or depicted on this site. Such intellectual property remains the property of its respective owners, and any references here are made solely for identification or informational purposes, without implying any affiliation, endorsement, or partnership.
We make no representations or warranties, express or implied, regarding the accuracy, completeness, or suitability of any content or products presented. Nothing on this website should be construed as legal, tax, investment, financial, medical, or other professional advice. In addition, no part of this site—including articles or product references—constitutes a solicitation, recommendation, endorsement, advertisement, or offer to buy or sell any securities, franchises, or other financial instruments, particularly in jurisdictions where such activity would be unlawful.
All content is of a general nature and may not address the specific circumstances of any individual or entity. It is not a substitute for professional advice or services. Any actions you take based on the information provided here are strictly at your own risk. You accept full responsibility for any decisions or outcomes arising from your use of this website and agree to release us from any liability in connection with your use of, or reliance upon, the content or products found herein.