
|
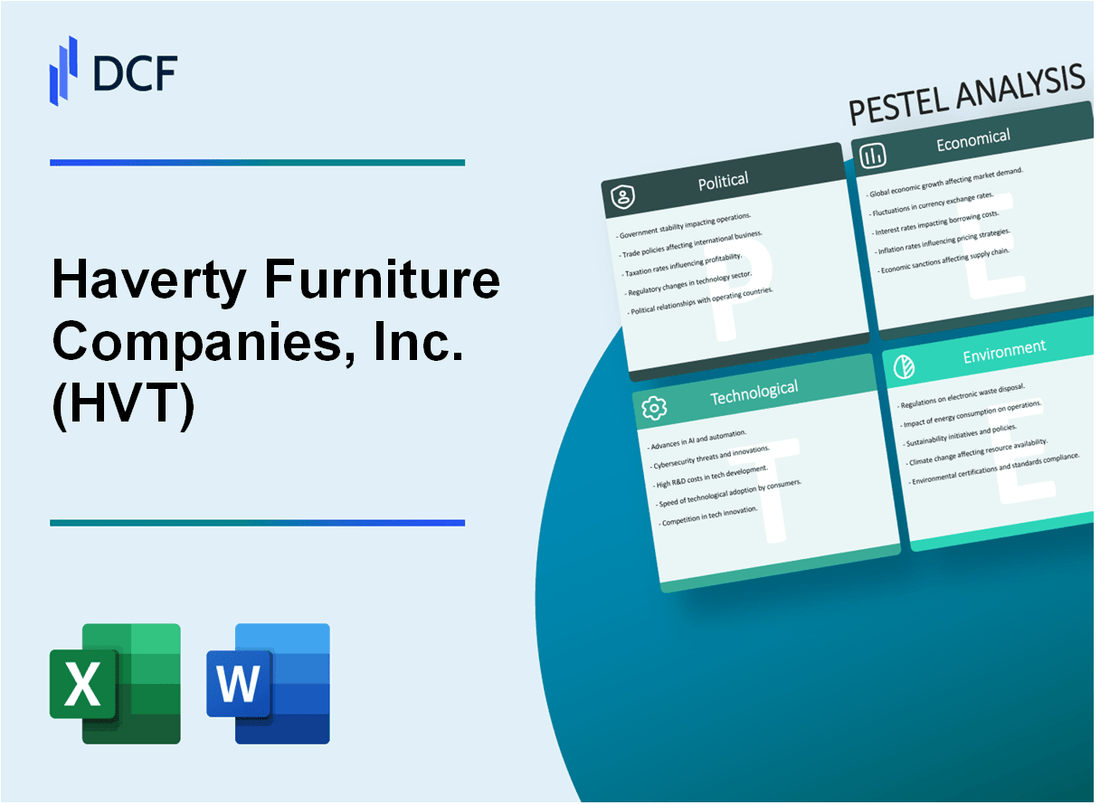
Haverty Furniture Companies, Inc. (HVT): PESTLE Analysis [Nov-2025 Updated] |
Fully Editable: Tailor To Your Needs In Excel Or Sheets
Professional Design: Trusted, Industry-Standard Templates
Investor-Approved Valuation Models
MAC/PC Compatible, Fully Unlocked
No Expertise Is Needed; Easy To Follow
Haverty Furniture Companies, Inc. (HVT) Bundle
You're looking for a clear-eyed view of Haverty Furniture Companies, Inc. (HVT) as we head into late 2025, and that means mapping the external landscape. HVT's 2025 outlook is a tightrope walk between consumer caution and operational necessity. Political tariffs and high interest rates are squeezing margins, even as the company targets a full-year revenue around $850 million. You need to see how the push for e-commerce and sustainable sourcing-the Sociological and Technological shifts-clash with Economic headwinds like persistent inflation and dampened housing turnover. This PESTLE analysis cuts through the noise to show you exactly where the near-term risks (like supply chain costs) and clear opportunities (like AR-driven shopping) lie for Haverty Furniture Companies, Inc.
Haverty Furniture Companies, Inc. (HVT) - PESTLE Analysis: Political factors
US-China trade tensions still drive tariff costs on imported furniture.
The political climate surrounding US-China trade has become a primary cost driver for furniture retailers like Haverty Furniture Companies, Inc. The situation is defintely not stable. New tariffs took effect on October 14, 2025, under the Trade Expansion Act, escalating levies on imported goods. Specifically, upholstered furniture and cabinets now face a 25% import tax, which is set to rise to a range of 30-50% in January 2026.
This is a direct hit to the cost of goods sold (COGS) for any company that sources heavily from Asia. For context, existing tariffs already applied a 30% levy on Chinese furniture imports and 20% on Vietnamese furniture. Haverty is actively managing this, but the impact is visible. The company's operating margin decreased to 3.3% in Q3 2025, down from 3.9% the previous year, with management citing the expectation that new tariffs will elevate costs further. The uncertainty alone led the company to pause additional store expansions, reducing its capital expenditure (CapEx) guidance earlier in 2025.
| Key Tariff Rates (Effective Q4 2025) | Product Category | Rate | Projected Rate (Jan 2026) |
|---|---|---|---|
| New Section 232 Tariffs | Upholstered Furniture/Cabinets | 25% | 30% to 50% |
| Existing Tariffs (Trade War Era) | Chinese Furniture Imports | 30% | N/A |
| Existing Tariffs (Trade War Era) | Vietnamese Furniture Imports | 20% | N/A |
Shifting import regulations require costly supply chain diversification efforts.
The political mandate to reduce reliance on certain Asian manufacturing hubs is forcing a structural change in the supply chain, which is expensive and complex. China and Vietnam together account for nearly 60% of U.S. furniture imports, so shifting that volume is a massive undertaking.
Haverty, like its peers, must diversify to regions less affected by tariffs to maintain competitive pricing and lead times. This means moving production to alternative countries, which requires a significant upfront investment in new vendor relationships, quality control, and logistics infrastructure. This is not just about finding a new factory; it's about a total supply chain overhaul. Honestly, that's a huge lift. This diversification also creates new challenges, including the risk of higher costs from increased warehousing and logistics complexity. The container logistics industry is already reacting, with 81% of businesses actively seeking new partnerships outside of traditional trade routes to manage this political risk.
Potential changes in corporate tax policy could impact net income margins.
The US tax landscape for corporations is more stable than the tariff environment, but key changes are still impacting net income. The corporate tax rate remains at a flat 21% for C-corporations like Haverty Furniture Companies, Inc. However, the 'One Big Beautiful Bill Act,' signed in July 2025, made a significant change to the deductibility of interest expense.
The new law permanently allows businesses to add back depreciation, amortization, and depletion deductions when calculating adjusted taxable income. This change is retroactive to the beginning of 2025 and provides a more generous measure for deductible interest expense, which is a positive for companies with debt. Additionally, for capital investments, the bonus depreciation rate for new and used equipment in 2025 is 40%, which provides a cash flow benefit by allowing a larger immediate deduction. These tax levers help offset some of the rising COGS pressure from tariffs.
Increased political pressure for domestic manufacturing sourcing remains a factor.
The political rhetoric explicitly favors domestic production, framing tariffs as a tool to protect US industries and bring back manufacturing jobs to states like North Carolina and Michigan. This creates a powerful incentive for retailers to highlight American-made products, even if they are more expensive.
The challenge is the sheer volume of imports: in a recent year, imports accounted for nearly 61% of all furniture sold in the US, including 86% of all wood furniture. While this political pressure benefits domestic manufacturers like Ethan Allen, which aimed for 70%+ American-made by 2025, it forces retailers like Haverty to navigate a bifurcated market. They must balance the cost-effective global supply chain with the political and consumer preference for domestic sourcing, which can be a difficult margin trade-off. The political spotlight on this issue is not going away, so expect continued focus on supply chain origin.
Haverty Furniture Companies, Inc. (HVT) - PESTLE Analysis: Economic factors
High interest rates dampen housing turnover, directly hitting big-ticket furniture sales.
You know the drill: furniture sales are tied directly to people moving into new homes. The biggest near-term headwind for Haverty Furniture Companies, Inc. (HVT) is the locked-up housing market, which means fewer people are buying and needing to furnish a whole new place. The US home turnover rate-the percentage of homes changing hands-hit its lowest level in decades through September 2025, with only about 28 out of every 1,000 homes transacting.
This stagnation is a direct result of the high-interest-rate environment. Even though the 30-year fixed mortgage rate eased slightly to an average of 6.27% as of mid-October 2025, it still offers limited relief to buyers compared to the low rates of previous years. Fannie Mae's revised forecast shows existing home sales are expected to rise only 4% in 2025, a significant downgrade from earlier, more optimistic projections. This low turnover means HVT has to fight harder for discretionary spending from existing homeowners rather than benefiting from the high-margin, whole-home purchases of new movers.
Persistent inflation keeps operational costs, especially freight and labor, elevated.
Inflation is stabilizing, but it's not gone, and it continues to squeeze HVT's margins on the operational side. US consumer prices rose 2.9% year-over-year in August 2025, driven partly by shelter costs and new tariffs. For HVT, this translates into higher costs across the supply chain, particularly in freight and labor. The company has explicitly guided that its gross profit margins, projected to be between 60.4% and 60.7% for the full year 2025, will be impacted by current estimates for product, freight, and LIFO (Last-In, First-Out) expenses.
Here's the quick math on their expense structure for the year:
- Fixed and Discretionary SG&A: Expected to be in the $296 million to $298 million range for 2025.
- Variable SG&A: Expected to be between 18.6% and 18.8% of net sales.
- Tariff Risk: The impact of new tariffs on imported goods is expected to elevate costs further, a key risk to maintaining the gross margin target.
Consumer discretionary spending remains volatile, impacting average order value.
While the broader economic outlook for 2025 anticipates inflation stabilizing around 2.5% and steady consumer spending driven by wage growth, HVT's customer base is showing a bifurcated trend. The good news is that high-income customers are still spending. Haverty's management noted that customers with household incomes over $150,000 are driving sales, which gives them confidence.
The company is successfully capturing high-value sales, which is a key opportunity. The average ticket increased 6.1% year-over-year to $3,668 in Q3 2025, and the design business average ticket rose even more sharply by 11.9% to $7,986. This focus on premium, design-driven sales is defintely a strategic buffer against overall market volatility, but it also means the company is more reliant on the top-tier consumer segment.
The table below summarizes key economic metrics and HVT's performance indicators as of late 2025:
| Economic Indicator | Latest 2025 Value / Forecast | Impact on HVT |
| 30-Year Fixed Mortgage Rate | Average 6.27% (Oct 2025) | Dampens housing turnover, limiting new home furnishing sales. |
| US Inflation Rate (CPI) | 2.9% (August 2025) | Keeps freight, product, and labor costs high, pressuring the 60.4% - 60.7% gross margin target. |
| HVT Q3 2025 Net Sales | $194.5 million | Strong quarterly performance, up 10.6% year-over-year. |
| HVT Average Ticket Value | $3,668 (Q3 2025) | 6.1% increase, showing success in capturing high-value discretionary spending. |
HVT's projected 2025 full-year revenue is conceptually around $850 million, still sensitive to recession fears.
Haverty Furniture Companies, Inc. reported a last twelve months (LTM) revenue of $741.43 million as of Q3 2025. To hit a conceptual full-year revenue target of $850 million, the company would need a strong fourth quarter-a goal that remains sensitive to any sudden economic downturn or a significant drop in consumer confidence. While the company's Q3 2025 revenue of $194.5 million was a strong beat, the general market remains cautious, maintaining a 'Hold' rating due to economic uncertainty.
The risk isn't just a recession; it's the fear of one, which can cause consumers to immediately pull back on big-ticket purchases like furniture. Even with a strong balance sheet-no funded debt and $137 million in cash and cash equivalents as of Q3 2025-HVT's top-line growth is a hostage to the macroeconomic climate. The company must continue its successful strategy of targeting the affluent buyer who is less rate-sensitive to bridge the gap between their current run-rate and more ambitious growth targets.
Haverty Furniture Companies, Inc. (HVT) - PESTLE Analysis: Social factors
Growing consumer demand for durable, high-quality, and sustainable home furnishings
You're seeing a clear shift in consumer psychology: people are moving away from fast furniture and treating their purchases as a long-term investment. This is a significant tailwind for a quality-focused retailer like Haverty Furniture Companies, Inc. (HVT). The market for sustainable furniture in the U.S. is a real growth engine, valued at $12.72 billion in 2025, and it's expanding faster than the broader sector. Consumers, especially Millennials and Gen Z, are driving this, with a reported 76% of them willing to pay a premium for eco-friendly pieces. That's a huge opportunity to capture higher-margin sales.
This isn't just about feeling good; it's about value. When household budgets are tight, a durable, high-quality sofa that lasts ten years is a smarter financial move than a cheaper one that needs replacing in three. We're seeing consumers prioritize pieces that justify a higher ticket price, which plays right into HVT's established brand image. The overall U.S. furniture market is projected to grow at a Compound Annual Growth Rate (CAGR) of 6.2% from 2025 to 2033, but the premium, durable segment is outpacing that.
Demographic shift to smaller households drives demand for versatile, multi-functional pieces
The escalating cost of housing is fundamentally changing how Americans furnish their homes. With the median sales price of houses sold in the U.S. hitting $416,900 in the first quarter of 2025, many buyers are settling for smaller spaces or renting for longer. This means the furniture you sell must work harder. It needs to be versatile.
The resulting demand for space-saving, multifunctional furniture is strong. The market for storage furniture alone is projected to rise at a CAGR of 7.3% from 2025 to 2033. Younger households are specifically channeling their budgets toward modular storage and sectional sofas that can optimize a smaller footprint. This trend requires HVT to defintely focus on designs that blend form and function, like extendable tables or storage-integrated beds.
Remote work trends sustain spending on home office and comfortable living spaces
The work-from-home revolution is no longer a temporary blip; it's a permanent fixture that continues to fuel home spending. The share of U.S. employees working from home reached 23% by mid-2024, a figure about 1.6 times higher than pre-pandemic levels. This has turned the home into a central hub for work, leisure, and family life, sustaining demand for comfortable, high-quality furniture beyond just the office.
The United States Work from Home Furniture Market, valued at $3.21 billion in 2024, is anticipated to grow to $5.60 billion by 2030 with a CAGR of 9.78%. This growth is driven by a focus on ergonomic designs for productivity. For HVT, this means a sustained opportunity not just in desks and chairs, but also in premium, durable living room furniture, as workers invest in comfortable, multi-use spaces.
- Demand for home office furniture is expected to rise over 15% annually through 2025.
- Consumers prioritize ergonomic and tech-integrated designs.
- The home is now a permanent co-working and living space.
Increased focus on 'buy now, pay later' (BNPL) financing options due to tighter consumer credit
Tighter consumer credit and persistent inflation mean many customers, even those buying premium items, are looking for flexible payment options to manage cash flow. This is why 'Buy Now, Pay Later' (BNPL) has become a critical social factor, especially in big-ticket retail like furniture. The number of American consumers using BNPL is expected to reach 91.5 million in 2025, a 5.78% year-over-year increase.
Here's the quick math: BNPL purchase volume in the U.S. is projected to total $122.3 billion in 2025, up 10.9% from the prior year. Home and furniture is the most popular spending category for BNPL users, with 42% making these purchases through installment plans. For a retailer like HVT, offering a seamless BNPL option is no longer a competitive edge-it's a requirement to convert a sale, especially since 36% of users rely on it for cash flow management. Honestly, if you don't offer it, you risk losing a significant portion of the younger, financially-conscious customer base.
| BNPL Adoption in U.S. (2025 Fiscal Year Data) | Amount/Percentage | Context |
|---|---|---|
| Projected U.S. BNPL Users | 91.5 million | Up 5.78% YoY in 2025. |
| Projected U.S. BNPL Purchase Volume | $122.3 billion | Up 10.9% YoY in 2025. |
| BNPL Use in Home & Furniture Category | 42% of users | Most popular spending category for BNPL. |
| Primary Reason for BNPL Use | 36% for cash flow management | Chief reason people turn to BNPL. |
Haverty Furniture Companies, Inc. (HVT) - PESTLE Analysis: Technological factors
E-commerce penetration must accelerate to compete with pure-play online retailers.
You're seeing the digital shift accelerate across all retail, and Haverty Furniture Companies, Inc. (HVT) is no exception. While the company maintains a strong physical footprint with 129 showrooms across 17 states, e-commerce penetration remains a key technological challenge and opportunity. In 2024, online sales accounted for approximately 3.0% of total sales [cite: 2 from step 2], which is low compared to pure-play online furniture competitors.
The good news is the digital segment is growing fast. Haverty Furniture's e-commerce sales grew by a strong 13.6% in Q3 2025 [cite: 6 from step 2], outpacing the overall sales growth of 10.6% for the quarter. This acceleration is crucial, but the company must defintely invest more to close the gap with digital-first rivals who capture a much larger share of the online furniture market.
Here's the quick math: to reach just 10% of the Q3 2025 net sales of $194.5 million from e-commerce alone, the company would need to generate nearly $19.5 million in online sales for that quarter, a significant jump from the current base.
Investment in augmented reality (AR) tools improves the virtual shopping experience.
The furniture industry is embracing Augmented Reality (AR) to overcome the biggest hurdle in online furniture shopping: visualization. Haverty Furniture is already making moves here, offering a 3-D room planner and upholstery customization tools on its website [cite: 2 from step 2]. This technology helps customers place virtual furniture in their actual living space, boosting confidence before purchase.
This is a smart investment because the industry data shows a clear return. For instance, similar visualization tools used by other major retailers have led to a 60% larger average basket size and a 25% reduction in returns in pilot programs [cite: 9 from step 2]. To keep pace, Haverty Furniture is allocating capital expenditures (CapEx) for technology, with approximately $2.6 million expected for Information Technology investments in 2025 [cite: 1 from step 1].
The goal is to merge the physical and digital retail experiences-what we call 'phygital'-to meet rising consumer expectations. Customers now expect to visualize items in their own space, and this technology is the bridge.
Supply chain visibility technology is crucial for managing lead times and inventory.
In a global furniture supply chain, visibility is everything. You cannot manage what you cannot see. Haverty Furniture has a long-standing foundation in advanced supply chain technology, leveraging a multi-party platform like Infor Nexus (a Supply Chain Network application) to orchestrate its complex global network of suppliers, carriers, and logistics providers.
This system provides end-to-end visibility, allowing the company to track goods from the overseas factory floor to the final warehouse delivery. This is critical for managing customer expectations and lead times, especially given the geopolitical and tariff uncertainties of 2025. The company's VP of Supply Chain, Abir Thakurta, emphasized at the NRF 2025 conference that the trick is to see supply chain uncertainty as an opportunity to outmaneuver the competition.
The continuous integration of this networked data, which was a key discussion point for Haverty Furniture at the Infor Nexus Connect 2025 event, ensures that logistics teams can use real-time Estimated Times of Arrival (ETAs) to schedule receiving at the warehouse, which in turn minimizes costly multiple delivery trips to customers.
Data analytics helps personalize marketing and optimize inventory across 120+ stores.
With 129 stores and a high average written ticket of $7,986 in Q3 2025 [cite: 3 from step 2], every customer interaction needs to be highly personalized. Data analytics is the engine for this. Haverty Furniture's strategic marketing investments, which contributed to an increase of $2.8 million in advertising and marketing costs in Q3 2025, are directly aimed at driving customer traffic and securing higher average tickets [cite: 4 from step 2].
The company is using data to optimize its omni-channel approach, focusing on two key areas:
- Personalized Marketing: Identifying customer segments most likely to purchase high-value items, like those who engage with the in-home design service (which accounted for 34.2% of written business in Q3 2025).
- Inventory Optimization: Using sales data and digital browsing patterns to ensure the right product mix is in the right regional distribution center, aiming for 'perfect inventory' to meet unpredictable consumer demand [cite: 4 from step 3].
This data-driven approach is essential for a retailer with a long purchase cycle, helping to predict the next purchase, like a customer buying a bedroom set after a dining room purchase, and then targeting them with a relevant campaign.
Haverty Furniture Companies, Inc. (HVT) - PESTLE Analysis: Legal factors
Compliance with complex state-level product safety and flammability standards (e.g., California).
The biggest legal shift for furniture retailers like Haverty Furniture Companies in recent years has been the federal adoption of what used to be a state-specific rule. The U.S. Consumer Product Safety Commission (CPSC) now mandates that all upholstered residential furniture manufactured or imported for sale in the U.S. must comply with the federal flammability standard, which is essentially the California Technical Bulletin 117-2013 (TB 117-2013) standard.
This national standard, effective since June 2021, requires upholstered furniture components-like cover fabrics and filling materials-to resist ignition from a smoldering cigarette. While this simplifies compliance by eliminating a patchwork of state rules, Haverty Furniture Companies still faces ongoing legal scrutiny and costs related to:
- Sourcing materials that meet the TB 117-2013 test methods.
- Ensuring all products bear the required permanent label stating, Complies with U.S. CPSC requirements for upholstered furniture flammability.
- Navigating California Proposition 65, which requires clear warnings for products containing certain listed chemicals, such as formaldehyde or specific flame retardants, common in furniture materials.
The compliance cost here is less about a new rule and more about consistent, rigorous supply chain vetting. It's defintely a non-negotiable cost of doing business.
Labor laws and wage mandates in key operating states increase payroll expenses.
Operating in 16 states means Haverty Furniture Companies must constantly adapt to a complex web of state and municipal labor laws, especially concerning minimum wage and overtime exemption thresholds. The trend is clear: state-level mandates are rising faster than the federal minimum wage of $7.25 per hour.
For example, in California, a key market, the state minimum wage increased to $16.50 per hour effective January 1, 2025. This increase also pushes the minimum annual salary for a full-time exempt employee (like a manager) to $68,640. Missouri, another state where Haverty Furniture Companies operates, saw its minimum wage rise to $13.75 per hour in 2025. This upward pressure on wages, even for non-minimum wage workers, directly impacts Selling, General, and Administrative (SG&A) expenses. The company reported an increase in administrative expenses of $3.4 million in Q2 2025, primarily driven by increased salaries and performance-based incentive compensation.
Data privacy regulations (like CCPA) require constant updates to customer data handling.
As a large retailer with significant online and in-store sales, Haverty Furniture Companies is subject to the California Consumer Privacy Act (CCPA), as amended by the California Privacy Rights Act (CPRA), because its annual revenue far exceeds the 2025 threshold of $26,625,000. The company's 2024 net sales were $722.9 million, so compliance is mandatory.
Compliance is a recurring operational expense. Large companies (over 500 employees) were initially estimated to face compliance costs of up to $2 million, and that's just the start. The real risk lies in penalties. Non-compliance can lead to fines of up to $7,988 per intentional violation, and the California Privacy Protection Agency (CPPA) is actively enforcing these rules, focusing on issues like Automated Decision-making Technology (ADMT) and mandatory Cybersecurity Audits in 2025. You need to treat customer data like the legal liability it is.
Lease agreements for their extensive retail footprint pose long-term contractual obligations.
The company's business model relies on a large retail footprint, operating 129 locations as of Q3 2025. The financial commitment for these stores and distribution centers is substantial, locked in through long-term operating lease agreements. This creates a massive long-term liability on the balance sheet.
To give you a sense of the scale, the total undiscounted future minimum lease payments for Haverty Furniture Companies were approximately $32.1 million for the year 2025 alone (based on the latest publicly available granular schedule). The total discounted operating lease liabilities on the balance sheet were over $230 million as of December 31, 2021. The legal risk here is twofold: the sheer size of the long-term contractual obligation and the rising cost of occupancy, which increased by $1.5 million in Q2 2025, largely due to costs related to new locations. Furthermore, new laws like California's SB 1103, effective January 1, 2025, introduce new tenant protections for 'qualifying commercial tenants,' which could slightly alter the landlord-tenant dynamic and notice requirements for rent increases in that key state.
| Legal Compliance Area | 2025 Key Legal Mandate/Threshold | Haverty Furniture Companies Impact/Metric |
|---|---|---|
| Product Safety (Flammability) | Federal adoption of California TB 117-2013 standard | Mandatory compliance for all upholstered goods sold in 129 locations |
| Labor & Wage Mandates | California Minimum Wage: $16.50/hour California Exempt Salary Threshold: $68,640/annually |
Contributed to $3.4 million increase in Q2 2025 administrative expenses (salaries/compensation) |
| Data Privacy (CCPA/CPRA) | Revenue Threshold: $26,625,000 Max Intentional Penalty: $7,988 per violation |
Applicable due to 2024 Net Sales of $722.9 million Requires ongoing operational compliance and risk assessment |
| Retail Lease Obligations | New commercial tenant protections (e.g., California SB 1103) | Estimated undiscounted minimum lease payments for 2025: $32.1 million Total operating lease liabilities (discounted) were over $230 million |
Haverty Furniture Companies, Inc. (HVT) - PESTLE Analysis: Environmental factors
Pressure to reduce the carbon footprint of global shipping and logistics operations.
The biggest environmental pressure point for Haverty Furniture Companies, Inc. is defintely its Scope 3 emissions-the indirect ones from its value chain, specifically global logistics. You see, a substantial portion of the company's wood products (case goods) and leather upholstery is imported from Asia, meaning long-haul ocean freight and subsequent road freight are major carbon drivers. While HVT does not publicly report its absolute 2025 Scope 3 emissions, the industry benchmark shows that international maritime shipping alone contributed 706 million metric tons of CO₂ in 2023, and road freight generates about 53% of CO₂ emissions within global trade-related transport.
This external pressure maps to a clear financial risk. As of Q3 2025, HVT reported consolidated sales of $194.5 million. Any future carbon taxes or fuel surcharges, driven by this global push for decarbonization, will hit the cost of goods sold (COGS) and directly erode the gross profit margin, which stood at a solid 60.3% in Q3 2025. The company has a good internal baseline, having achieved a 46% reduction in electric energy usage compared to its 2008 baseline by 2018 across its nearly 7 million square feet of facilities, but that only addresses a fraction of the total footprint.
Here's the quick math on the challenge:
- Air freight is roughly 2.57 lbs CO₂ per ton-mile.
- Truck freight is about 0.4 lbs CO₂ per ton-mile.
- Ocean freight is the most efficient at 0.13 lbs CO₂ per ton-mile, but the sheer volume of imports makes it the primary risk.
The company's planned $24.0 million in 2025 capital expenditures should include investments in logistics optimization software to consolidate shipments and reduce empty miles. That's a clear action item.
Increased consumer scrutiny on the sourcing of wood and other raw materials.
This is a critical, near-term risk that went from a voluntary best practice to a regulatory mandate in 2024/2025. The U.S. Lacey Act, which prohibits the trade of illegally sourced plants and plant products, was significantly expanded in June 2024 with Phase VII. This expansion now requires importers of wooden furniture-which is a core product for HVT-to provide a formal declaration that includes the genus, species, and country of origin of the wood.
What this means is that HVT's supply chain transparency must be absolute, especially since most of its wood products are imported from Asia. Failure to comply can result in fines, penalties, and seizure of goods, which is a direct hit to inventory and brand reputation. The market is increasingly demanding third-party verification, such as Forest Stewardship Council (FSC) certification, which provides a credible verification of legality and sustainable forest management.
The external pressure is high, and the internal disclosure is low.
| Raw Material Risk Factor | 2025 Regulatory Impact | Haverty Furniture Companies, Inc. Action Required |
|---|---|---|
| Illegal Logging/Sourcing | U.S. Lacey Act Phase VII (June 2024) mandates species and country of origin declaration for all wooden furniture imports. | Implement a granular, auditable supplier tracking system for all Asian imports to ensure full compliance and avoid forfeiture risk. |
| Deforestation/Biodiversity Loss | Increasing consumer demand for certified wood (FSC, SFI) as a standard for furniture. | Formalize a public wood sourcing policy and begin requiring a minimum percentage of FSC-Mix or FSC-Certified wood from suppliers. |
Need for better waste management and recycling programs for packaging and old furniture.
The furniture sector has a massive waste problem, primarily from bulky product packaging and old furniture disposal. The overall waste and recycling market is seeing strong growth, with a projected compound annual growth rate (CAGR) of 5.1% from 2024 to 2025, which shows the scale of the industry shift. HVT has a long history of internal recycling, having been recognized by environmental services company Avangard Innovative every year since 2014 for its efforts.
However, the focus is shifting from simply recycling cardboard in the warehouse to addressing the entire product lifecycle, including reverse logistics (handling returns and old furniture). The key opportunity here is a circular economy model. For instance, a major North American waste company diverted over 1.2 million tons of combined material from disposal in 2024.
HVT needs to move beyond internal facility recycling to a customer-facing 'take-back' program for old furniture, especially since the waste stream is a growing concern. What this estimate hides is the volume of Styrofoam and plastic wrap used in importing case goods; those are the real packaging targets.
Reporting requirements for Environmental, Social, and Governance (ESG) metrics are defintely increasing.
While HVT currently uses its 'Stewardship' tear sheet, the regulatory environment for large, publicly traded U.S. companies is moving toward mandatory, standardized ESG disclosure. The Sustainability Accounting Standards Board (SASB) standards, which HVT references, are now part of the International Sustainability Standards Board (ISSB), pushing for more comparable and decision-useful data.
The most significant increase in scrutiny is on Scope 3 emissions (the supply chain), which is a huge blind spot for furniture retailers. Investors and financial professionals are increasingly prioritizing this data. For you, the financially-literate decision-maker, the lack of a current, quantifiable GHG emissions table from HVT creates an information gap when assessing long-term climate risk and capital allocation. The market will soon penalize companies that cannot provide this data. The next step is clear: HVT needs to calculate and disclose its 2025 Scope 3 emissions, driven by its Asian import supply chain, to meet evolving investor expectations.
Disclaimer
All information, articles, and product details provided on this website are for general informational and educational purposes only. We do not claim any ownership over, nor do we intend to infringe upon, any trademarks, copyrights, logos, brand names, or other intellectual property mentioned or depicted on this site. Such intellectual property remains the property of its respective owners, and any references here are made solely for identification or informational purposes, without implying any affiliation, endorsement, or partnership.
We make no representations or warranties, express or implied, regarding the accuracy, completeness, or suitability of any content or products presented. Nothing on this website should be construed as legal, tax, investment, financial, medical, or other professional advice. In addition, no part of this site—including articles or product references—constitutes a solicitation, recommendation, endorsement, advertisement, or offer to buy or sell any securities, franchises, or other financial instruments, particularly in jurisdictions where such activity would be unlawful.
All content is of a general nature and may not address the specific circumstances of any individual or entity. It is not a substitute for professional advice or services. Any actions you take based on the information provided here are strictly at your own risk. You accept full responsibility for any decisions or outcomes arising from your use of this website and agree to release us from any liability in connection with your use of, or reliance upon, the content or products found herein.